Single-channel Ca(2+) imaging implicates Aβ1-42 amyloid pores in Alzheimer's disease pathology - PubMed (original) (raw)
Single-channel Ca(2+) imaging implicates Aβ1-42 amyloid pores in Alzheimer's disease pathology
Angelo Demuro et al. J Cell Biol. 2011.
Abstract
Oligomeric forms of Aβ peptides are implicated in Alzheimer's disease (AD) and disrupt membrane integrity, leading to cytosolic calcium (Ca(2+)) elevation. Proposed mechanisms by which Aβ mediates its effects include lipid destabilization, activation of native membrane channels, and aggregation of Aβ into Ca(2+)-permeable pores. We distinguished between these using total internal reflection fluorescence (TIRF) microscopy to image Ca(2+) influx in Xenopus laevis oocytes. Aβ1-42 oligomers evoked single-channel Ca(2+) fluorescence transients (SCCaFTs), which resembled those from classical ion channels but which were not attributable to endogenous oocyte channels. SCCaFTs displayed widely variable open probabilities (P(o)) and stepwise transitions among multiple amplitude levels reminiscent of subconductance levels of ion channels. The proportion of high P(o), large amplitude SCCaFTs grew with time, suggesting that continued oligomer aggregation results in the formation of highly toxic pores. We conclude that formation of intrinsic Ca(2+)-permeable membrane pores is a major pathological mechanism in AD and introduce TIRF imaging for massively parallel single-channel studies of the incorporation, assembly, and properties of amyloidogenic oligomers.
Figures
Figure 1.
Western blot analysis of Aβ1−42 oligomer preparations and assay of potency to evoke Ca2+ influx in Xenopus oocytes. (A and B) Western blots showing aggregation profiles of Aβ1–42 at 30 min after initially dissolving Aβ peptide monomer (A) and after 48 h of incubation (B). 4 µg of samples was separated using gel electrophoresis on a 4–20% Tris-HCl gel. The membranes were probed separately with a monoclonal antibody, 6E10, which is sequence specific to Aβ, and with OC antibody, which recognizes a generic epitope associated with the fibrillar amyloid conformation independent of peptide sequence. Black lines indicate that intervening lanes have been spliced out. (C and D) Bioassay of the potency of Aβ1–42 oligomer preparations to induce membrane permeability to Ca2+. The traces in C show representative global Ca2+ fluorescence signals (indicated as F; top) and corresponding voltage-clamped membrane currents (indicated as I; bottom) evoked by 30-s voltage steps from 0 to −100 mV delivered at various times (indicated in minutes) before and after pipette application of Aβ1−42 oligomers to a nonpeeled oocyte loaded with fluo-4 dextran. (D) Measurements of inward currents (without leak subtraction) evoked by voltage steps from 0 to −100 mV taken at 5-min intervals after application of Aβ1−42 (final bath concentration of 1 µg/ml). Data show means ± 1 SEM from four oocytes using two different Aβ1−42 oligomer preparations.
Figure 2.
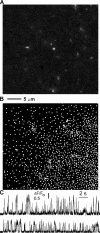
Aβ1–42 oligomers form Ca2+-permeable ion pores in the plasma membrane of Xenopus oocytes. (A) Representative image showing localized Ca2+ transients (SCCaFTs) imaged by TIRF microscopy during hyperpolarization to −100 mV within a 40 × 40–µm region of a vitelline-stripped oocyte loaded with fluo-4 dextran and EGTA. The imaging region was close to the edge of the footprint of the oocyte on the cover glass, and 1 µg/ml Aβ1−42 oligomers was applied to the bathing solution ∼18 min beforehand from a pipette positioned near the bottom right corner of the image frame. No activity was observed before application of Aβ1−42. The grayscale image of fluorescence ratio changes (ΔF/Fo; black = 0, white = 1.6) shows a mean of six consecutive video frames (2 ms per frame) from within a sequence of 15,000 frames. (B) Map showing the locations of all SCCaFTs (Aβ pores) identified during a 20-s recording from the membrane region in A. The map was automatically constructed by CellSpecks by identifying the coordinates of each SCCaFT. (C) Representative fluorescence profiles from regions of interest (1 µm2) centered on two pore locations.
Figure 3.
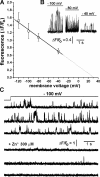
Ca2+ influx through Aβ1−42 pores is voltage dependent and blocked by Zn2+. (A) Amplitudes of SCCaFTs from Aβ1−42 pores plotted as function of membrane potential. Points show mean amplitudes (ΔF/F0) ± 1 SEM from >30 events from 10 different pores. The fitted regression line extrapolates to 0 at about 30 mV. (B) Superimposed records of SCCaFTs recorded from 26 Aβ pore sites at the voltages indicated. (C) Representative traces from three regions of interest showing control records of SCCaFTs induced by Aβ1−42 (top) and records from the same regions 5 min after adding 300 µM Zn2+ to the bathing solution.
Figure 4.
SCCaFTs generated by Aβ1−42 display multiple Ca2+ flux levels. (A) The trace at the left shows a representative record of SCCaFTs induced by Aβ1−42 oligomers, and the trace at the right shows the segment marked by the gray box on an expanded timescale. The bars indicate Ca2+ fluorescence levels (ΔF/F0) corresponding to different amplitude dwell states during SCCaFTs. (B) Distribution of dwell-state amplitude levels during Aβ1−42 SCCaFTs measured by visual inspection of traces from 76 pores selected from a single image record. (C) Distribution of the maximum SCCaFT amplitude observed at a given site generated by CellSpecks from an image sequence that encompassed 2,820 total sites. Data are representative of results from three or more image records obtained in each of four oocytes.
Figure 5.
Aβ1−42 pores display wide variability in kinetics and Po. (A) Channel-chip representation of the activity of Aβ1−42 pores. Pore openings (SCCaFTs) are represented as pseudocolored streaks, with warmer colors representing higher fluorescence signals, as indicated by the color bar; time runs from left to right. The top panel illustrates the activity of 170 different pores showing the highest Po values among a total of 2,820 pores detected by CellSpecks within a single imaging frame (40 × 40 µm2). Pores are depicted top to bottom in order of decreasing Po. The bottom panels show consecutive expanded views of the regions marked by the white boxes. (B) Representative traces showing activity from six different pores, illustrating those with high (top two traces), medium (middle two traces), and low (bottom two traces) Po.
Figure 6.
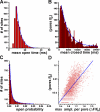
Gating kinetics of Aβ1−42 pores. (A) Distribution of mean open durations (SCCaFT durations) among the 2,820 pores. (B) Corresponding distribution of mean closed times (intervals between SCCaFTs). (C) Corresponding distribution of mean open probabilities (Po; measured as proportion of time for which the fluorescence exceeded a threshold level above the baseline). (D) The Po of pores strongly correlates with their calcium permeability. The scatter plot shows the Po of pores as a function of the amplitude (ampl.) of the largest SCCaFT observed from that pore. (A–C) The blue curves are double exponential fits, with decay constants of 5.3 and 16.3 ms (A), 3.8 and 54 s (B), and 0.0017 and 0.0096 s (C). Data are representative of results from three or more image records obtained in each of four oocytes.
Figure 7.
Aβ1−42 pores with high open probabilities contribute disproportionately to the total cellular Ca2+ load. The Ca2+ load contributed by a given pore was determined by integrating the area under the fluorescence trace (30-s duration), during which the fluorescence exceeded a threshold of 0.2 ΔF/Fo. (A–F) The abscissa represents the number of pores within a 10 × 10–µm imaging field ranked in order of increasing Ca2+ load and normalized to 100%. (A–C) Data obtained 20 min after application of Aβ1−42 are shown. Plots of pore Po (B) and amplitude of the largest SCCaFT observed at each site (C) on the same abscissa as in A are shown. (D–F) Corresponding analyses from the same membrane region as in A–C obtained 10 min later, showing a marked increase in proportion of pores contributing a high Ca2+ load. Blue bars (righthand ordinate; shown in A) show the Ca2+ load contributed by each individual pore expressed as an integral of the fluorescence signals during all SCCaFTs detected at that site. The curve (left ordinate; red) plots the cumulative contribution of pores toward the normalized total Ca2+ load.
Similar articles
- Analyzing and Modeling the Kinetics of Amyloid Beta Pores Associated with Alzheimer's Disease Pathology.
Ullah G, Demuro A, Parker I, Pearson JE. Ullah G, et al. PLoS One. 2015 Sep 8;10(9):e0137357. doi: 10.1371/journal.pone.0137357. eCollection 2015. PLoS One. 2015. PMID: 26348728 Free PMC article. - Amyloid β Ion Channels in a Membrane Comprising Brain Total Lipid Extracts.
Lee J, Kim YH, T Arce F, Gillman AL, Jang H, Kagan BL, Nussinov R, Yang J, Lal R. Lee J, et al. ACS Chem Neurosci. 2017 Jun 21;8(6):1348-1357. doi: 10.1021/acschemneuro.7b00006. Epub 2017 Feb 20. ACS Chem Neurosci. 2017. PMID: 28135799 Free PMC article. - Ion Channel Formation by Amyloid-β42 Oligomers but Not Amyloid-β40 in Cellular Membranes.
Bode DC, Baker MD, Viles JH. Bode DC, et al. J Biol Chem. 2017 Jan 27;292(4):1404-1413. doi: 10.1074/jbc.M116.762526. Epub 2016 Dec 7. J Biol Chem. 2017. PMID: 27927987 Free PMC article. - Imaging Amyloid-β Membrane Interactions: Ion-Channel Pores and Lipid-Bilayer Permeability in Alzheimer's Disease.
Viles JH. Viles JH. Angew Chem Int Ed Engl. 2023 Jun 19;62(25):e202215785. doi: 10.1002/anie.202215785. Epub 2023 Mar 30. Angew Chem Int Ed Engl. 2023. PMID: 36876912 Free PMC article. Review. - Imaging single-channel calcium microdomains.
Demuro A, Parker I. Demuro A, et al. Cell Calcium. 2006 Nov-Dec;40(5-6):413-22. doi: 10.1016/j.ceca.2006.08.006. Epub 2006 Oct 25. Cell Calcium. 2006. PMID: 17067668 Free PMC article. Review.
Cited by
- Exploring the Potential of Therapeutic Agents Targeted towards Mitigating the Events Associated with Amyloid-β Cascade in Alzheimer's Disease.
Behl T, Kaur I, Fratila O, Brata R, Bungau S. Behl T, et al. Int J Mol Sci. 2020 Oct 9;21(20):7443. doi: 10.3390/ijms21207443. Int J Mol Sci. 2020. PMID: 33050199 Free PMC article. Review. - Relationships Between Ion Channels, Mitochondrial Functions and Inflammation in Human Aging.
Strickland M, Yacoubi-Loueslati B, Bouhaouala-Zahar B, Pender SLF, Larbi A. Strickland M, et al. Front Physiol. 2019 Mar 1;10:158. doi: 10.3389/fphys.2019.00158. eCollection 2019. Front Physiol. 2019. PMID: 30881309 Free PMC article. Review. - Region-specific amyloid-β accumulation in the olfactory system influences olfactory sensory neuronal dysfunction in 5xFAD mice.
Son G, Yoo SJ, Kang S, Rasheed A, Jung DH, Park H, Cho B, Steinbusch HWM, Chang KA, Suh YH, Moon C. Son G, et al. Alzheimers Res Ther. 2021 Jan 4;13(1):4. doi: 10.1186/s13195-020-00730-2. Alzheimers Res Ther. 2021. PMID: 33397474 Free PMC article. - Amyloid-β peptide-induced extracellular S100A9 depletion is associated with decrease of antimicrobial peptide activity in human THP-1 monocytes.
Lee EO, Yang JH, Chang KA, Suh YH, Chong YH. Lee EO, et al. J Neuroinflammation. 2013 May 30;10:68. doi: 10.1186/1742-2094-10-68. J Neuroinflammation. 2013. PMID: 23721320 Free PMC article. - Biophysical insights into how surfaces, including lipid membranes, modulate protein aggregation related to neurodegeneration.
Burke KA, Yates EA, Legleiter J. Burke KA, et al. Front Neurol. 2013 Mar 1;4:17. doi: 10.3389/fneur.2013.00017. eCollection 2013. Front Neurol. 2013. PMID: 23459674 Free PMC article.
References
- Alberdi E., Sánchez-Gómez M.V., Cavaliere F., Pérez-Samartín A., Zugaza J.L., Trullas R., Domercq M., Matute C. 2010. Amyloid beta oligomers induce Ca2+ dysregulation and neuronal death through activation of ionotropic glutamate receptors. Cell Calcium. 47:264–272 10.1016/j.ceca.2009.12.010 - DOI - PubMed
Publication types
MeSH terms
Substances
Grants and funding
- R01 GM048071/GM/NIGMS NIH HHS/United States
- R37 GM048071/GM/NIGMS NIH HHS/United States
- GM48071/GM/NIGMS NIH HHS/United States
- P50 AG016573/AG/NIA NIH HHS/United States
- P50-AG16573/AG/NIA NIH HHS/United States


