Actin filament severing by cofilin is more important for assembly than constriction of the cytokinetic contractile ring - PubMed (original) (raw)
Actin filament severing by cofilin is more important for assembly than constriction of the cytokinetic contractile ring
Qian Chen et al. J Cell Biol. 2011.
Abstract
We created two new mutants of fission yeast cofilin to investigate why cytokinesis in many organisms depends on this small actin-binding protein. These mutant cofilins bound actin monomers normally, but bound and severed ADP-actin filaments much slower than wild-type cofilin. Cells depending on mutant cofilins condensed nodes, precursors of the contractile ring, into clumps rather than rings. Starting from clumped nodes, mutant cells slowly assembled rings from diverse intermediate structures including spiral strands containing actin filaments and other contractile ring proteins. This process in mutant cells depended on α-actinin. These slowly assembled contractile rings constricted at a normal rate but with more variability, indicating ring constriction is not very sensitive to defects in severing by cofilin. Computer simulations of the search-capture-pull and release model of contractile ring formation predicted that nodes clump when the release step is slow, so cofilin severing of actin filament connections between nodes likely contributes to the release step.
Figures
Figure 1.
Mutant cofilins with defects in severing actin filaments. (A) Growth of wild-type and mutant strains. Drops with 10-fold serial dilutions were plated on YE5s agar and grown for 4 d at 25°C, or for 3 d at 30 or 36°C. (B) Ribbon diagram of fission yeast cofilin (PDB: 2i2q) rendered by PyMol (DeLano Scientific). Arrows indicate sites of point mutations in adf1-M1 (P10A, E11A), adf1-M2 (K23A, S24A, R25A), and adf1-M3 (E132A, K133A). (C–F) Biochemical characterization of wild-type cofilin (red symbols and lines), cofilin-M2 (blue), and cofilin-M3 (green). (C) Dependence of kobs for dissociation of etheno-ATP from actin monomers in 1 mM MgCl2, 1 mM EGTA, 2 mM TrisCl, and 0.5 mM DTT, pH 8.0 on the concentrations of the three cofilins. The smooth curves are fits of the binding equation (Bryan, 1988; Hawkins et al., 1993) yielding the Kds listed in Table II. (D) Equilibrium binding of a range of cofilin concentrations to 2 µM pyrene-labeled actin filaments in KMEI polymerization buffer (50 mM KCl, 1 mM MgCl2, 1 mM EGTA, and 10 mM imidazole, pH 7.0) measured by fluorescence after 0.5 h incubation. The fraction bound was calculated from the fluorescence decrease relative to the maximum decrease. The free cofilin concentration was the total cofilin in the reaction minus the cofilin bound to the actin filaments. (E) Time course of 3 µM cofilin binding to 1 µM pyrene-labeled actin filaments in KMEI polymerization buffer measured by the decrease in fluorescence. Fits of a single exponential equation to the data gave observed rate constants (kobs) of 73.6 s−1 (wild type), 3.0 s−1 (cofilin-M2), and 8.9 s−1 (cofilin-M3). (E′) Concentration dependence of kobs for cofilin binding to 2 µM pyrene-labeled actin filaments in KMEI polymerization buffer. Each data point is an average of kobs for at least three reactions. (F) Cofilin concentration dependence of the actin filament–severing rate in TIRF buffer observed by total internal reflection fluorescence (TIRF) microscopy (see
Fig. S2 E
). Severing of actin filaments by 200 nM cofilin-M3 was negligible. Error bars represent the standard deviations.
Figure 2.
Cytokinesis defects in cells with mutant cofilins. Comparison of wild-type (adf1+), adf1-M2, and adf1-M3 cells. (A) DIC images at 25°C. (B) Fixed cells stained with DAPI showing many mutant cells with two nuclei. (C) Histograms of the fractions of cells with two or more nuclei in samples of >300 cells of each strain grown at 25 or 30°C in two separate experiments, fixed and stained with DAPI. (D) Fixed cells stained with Bodipy-phallacidin showing thick bundles of actin filaments in the middle of many mutant cells (arrows). Bars, 10 µm.
Figure 3.
Contractile ring assembly in strains with cofilin mutations. (A) Time course of the accumulation of complete contractile rings in populations of wild-type (adf1+), adf1-M2, and adf1-M3 cells with the separation of SPBs at time zero. (B–D) Time-lapse series of negative-contrast fluorescence micrographs showing contractile ring assembly in cells expressing Rlc1p-3GFP and the spindle pole body (SPB) marker Sad1-GFP. Maximum intensity projections were titled 45° to show SPBs and contractile rings and their precursors in B and C. Numbers are times in minutes after SPB separation. Empty arrowheads mark SPBs before they split and filled arrowheads mark separated SPBs. Asterisks mark the completion of contractile rings. Bars, 5 µm. (B) This wild-type cell assembled a complete contractile ring by time +10 min (also see
Video 3
). (C) This adf1-M2 cell split its SPB at time zero and condensed the nodes into clumps between time −2 to +8 min. During the following 70 min, strands containing myosin-II grew from these clumps and assembled a complete ring, which then constricted (also see
Video 4
). (D) Two conjoined daughter adf1-M3 cells (DIC image shown on the left) underwent the next round of cytokinesis simultaneously but differed in the time to assemble contractile rings: time +14 min for the bottom cell (filled arrow) and time +28 min for the top cell (empty arrow).
Figure 4.
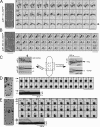
Node movements in wild-type and cofilin mutant cells. Negative-contrast fluorescence micrographs of cells with nodes marked by Rlcp-3GFP at 25°C. Numbers are time in seconds on an arbitrary time scale. Bars, 5 µm. (A and B) A DIC image of each cell is shown on the left with the region of interest highlighted by dashed lines. Montages show time series of single confocal sections. (A) This wild-type cell condensed nodes into a ring (arrow) in 480 s from the beginning of this series. The interval between each frame is 20 s. Also see
Video 5
. (B) The nodes in this adf1-M3 cell formed one big clump and a small clump (empty arrows). Also see
Videos 6
and
7
. (C) Kymographs of node movements in an adf1+ cell (from A) and an adf1-M3 cell (from B). Kymographs were constructed from time series of projections of the top confocal section of the regions of interest (dashed rectangle) onto lines either perpendicular (left) or parallel (right) to the long axis of the cell. Over time nodes formed either a contractile ring (arrow) or clumps (empty arrows). (D and E) Motions of nodes (closed head arrows) relative to clumps (open head arrows) in adf1-M2 cells. Boxes outline regions of interest (ROI) in maximum intensity projections of a Z-series of fluorescence micrographs of whole cells (dashed lines) at the start of the time series. Kymographs were generated as in C. (D) A node merged with a nearby clump of nodes. The ROI was rotated 90° clockwise for viewing. (E) Two nodes merged with each other before merging with a clump of nodes.
Figure 5.
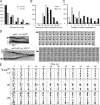
Measurements and simulations of node movements in wild-type and cofilin mutant cells. (A) The numbers of clumps of nodes stationary for ≥10 min in adf1-M2 (black, n = 88) and adf1-M3 (gray, n = 72) cells. (B) Histogram of the distribution of the durations of node movements in wild-type (unfilled, n = 36) and adf1-M2 (black, n = 37) cells. (C) Histogram of the distributions of node velocities in wild-type and _adf1_-M2 cells. A–C are based on data from single experiments, exacted from multiple image sets acquired independently. (D) Time-lapse fluorescence micrographs of moving nodes in an adf1+ cell (top) and an adf1-M2 cell (bottom). Intervals between frames are 3 s. Left, kymographs of each time lapse series made as in Fig. 4 C. The node in the adf1+ cell (arrow) alternated between pauses and directed movements, while the node in the adf1-M2 cell (arrow) moved for a much longer time. Bars, 1 µm. (E) Snapshots of Monte Carlo simulations of the search-capture-pull and release model of contractile ring assembly (Vavylonis et al., 2008). Top two rows show simulations with a cell radius of 1.8 µm and two values of τbreak, based on node movements in adf1+ (14 s) and adf1-M2 (26 s) cells. The bottom row is a simulation with τbreak = 26 s and the radius of cofilin mutant cells, 2.4 µm. The equator of the cell is filleted open with the circumference vertical for display. The 65 nodes in the broad band are indicated as gray dots. Nodes form clumps (empty arrows), with τbreak = 26 s. The numbers on the top are times in seconds. Representatives from multiple simulations are shown.
Figure 6.
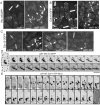
Slow unreliable assembly of contractile rings from clumps in cofilin mutant cells. (A–C) Fluorescence micrographs of maximum intensity projections of wild-type and cofilin mutant cells expressing fluorescent proteins fused to contractile ring proteins. These proteins concentrated in strands (arrows) in dividing cells. (A) Rlc1p-mEGFP in wild-type and adf1-M2 cells. (B) GFP-Cdc15p in wild-type and adf1-M3 cells. (C) Cdc12p-3GFP in wild-type, adf1-M2, and adf1-M3 cells. (D and E) Time series of maximum intensity projections of negative-contrast confocal slides; fluorescence micrographs of cells expressing Rlc1p-3GFP. Numbers are times in minutes. (D) This adf1-M2 cell assembled a contractile ring from two clumps of nodes (empty arrows). The region of interest is outlined in the image of the whole cell on the left. (E) This adf1-M2 Δain1 cell failed to assemble stable strands or a ring. The last frame is a DIC micrograph showing the cell at the last time point. Bars, 5 µm.
Figure 7.
Contractile ring constriction in wild-type and cofilin mutant cells. Time courses of contractile ring constriction observed by fluorescence microscopy of adf1-M2, adf1-M3, adf1-1, and wild-type strains expressing Rlc1p-3GFP at 25°C. Bars, 5 µm. (A–C) Time series of maximum intensity projections of fluorescence images of three adf1-M2 rlc1-3GFP cells. Numbers are times in minutes from the beginning of the recordings. (A′–C′) Kymographs of ring constriction by cells A, B, and C constructed by projecting fluorescence of the rings onto a time line. (D) Time course of changes in contractile ring circumference calculated from projection images for cells A–C. Constriction rates: (A) 0.31 µm/min; (B) 0.56 µm/min; (C) 0.16 µm/min. (E) Box plots of contractile ring constriction rates. The horizontal line in the box is the median. The top and bottom of the box include ± 25% from the mean value of the population. The lines extending from the top and bottom of each box mark the minimum and maximum values except for one outlier (displayed as a single point), which exceeded the median ± the inter-quartile value. Average constriction rates were indistinguishable in these four strains: 0.30 ± 0.03 µm/min (wild type, n = 14), 0.33 ± 0.02 µm/min (adf1-1, n = 13), 0.32 ± 0.10 µm/min (adf1-M2, n = 17), and 0.30 ± 0.08 µm/min (adf1-M3, n = 11). Variances were larger for adf1-M2 and adf1-M3 cells than for wild-type cells. (F) Contractile rings reconstructed from Z-series of fluorescence micrographs. Contractile rings in adf1-M2 and adf1-M3 cells were less homogeneous with some thicker bundles (arrowheads) than wild-type adf1+ cells. Bar, 5 µm.
Similar articles
- Contractile-ring assembly in fission yeast cytokinesis: Recent advances and new perspectives.
Lee IJ, Coffman VC, Wu JQ. Lee IJ, et al. Cytoskeleton (Hoboken). 2012 Oct;69(10):751-63. doi: 10.1002/cm.21052. Epub 2012 Aug 23. Cytoskeleton (Hoboken). 2012. PMID: 22887981 Free PMC article. Review. - Aip1 promotes actin filament severing by cofilin and regulates constriction of the cytokinetic contractile ring.
Chen Q, Courtemanche N, Pollard TD. Chen Q, et al. J Biol Chem. 2015 Jan 23;290(4):2289-300. doi: 10.1074/jbc.M114.612978. Epub 2014 Dec 1. J Biol Chem. 2015. PMID: 25451933 Free PMC article. - Actin turnover protects the cytokinetic contractile ring from structural instability.
McDargh Z, Zhu T, Zhu H, O'Shaughnessy B. McDargh Z, et al. J Cell Sci. 2023 Mar 1;136(5):jcs259969. doi: 10.1242/jcs.259969. Epub 2022 Oct 6. J Cell Sci. 2023. PMID: 36052670 Free PMC article. - Fimbrin and tropomyosin competition regulates endocytosis and cytokinesis kinetics in fission yeast.
Skau CT, Kovar DR. Skau CT, et al. Curr Biol. 2010 Aug 24;20(16):1415-22. doi: 10.1016/j.cub.2010.06.020. Epub 2010 Aug 12. Curr Biol. 2010. PMID: 20705466 Free PMC article. - Biophysics of actin filament severing by cofilin.
Elam WA, Kang H, De la Cruz EM. Elam WA, et al. FEBS Lett. 2013 Apr 17;587(8):1215-9. doi: 10.1016/j.febslet.2013.01.062. Epub 2013 Feb 5. FEBS Lett. 2013. PMID: 23395798 Free PMC article. Review.
Cited by
- Thyroid hormone increases fibroblast growth factor receptor expression and disrupts cell mechanics in the developing organ of corti.
Szarama KB, Gavara N, Petralia RS, Chadwick RS, Kelley MW. Szarama KB, et al. BMC Dev Biol. 2013 Feb 9;13:6. doi: 10.1186/1471-213X-13-6. BMC Dev Biol. 2013. PMID: 23394545 Free PMC article. - Contractile-ring assembly in fission yeast cytokinesis: Recent advances and new perspectives.
Lee IJ, Coffman VC, Wu JQ. Lee IJ, et al. Cytoskeleton (Hoboken). 2012 Oct;69(10):751-63. doi: 10.1002/cm.21052. Epub 2012 Aug 23. Cytoskeleton (Hoboken). 2012. PMID: 22887981 Free PMC article. Review. - Novel roles for actin in mitochondrial fission.
Hatch AL, Gurel PS, Higgs HN. Hatch AL, et al. J Cell Sci. 2014 Nov 1;127(Pt 21):4549-60. doi: 10.1242/jcs.153791. Epub 2014 Sep 12. J Cell Sci. 2014. PMID: 25217628 Free PMC article. - Role of actin depolymerizing factor cofilin in Aspergillus fumigatus oxidative stress response and pathogenesis.
Jia X, Zhang X, Hu Y, Hu M, Tian S, Han X, Sun Y, Han L. Jia X, et al. Curr Genet. 2018 Jun;64(3):619-634. doi: 10.1007/s00294-017-0777-5. Epub 2017 Nov 23. Curr Genet. 2018. PMID: 29170805 - Curvature-induced expulsion of actomyosin bundles during cytokinetic ring contraction.
Huang J, Chew TG, Gu Y, Palani S, Kamnev A, Martin DS, Carter NJ, Cross RA, Oliferenko S, Balasubramanian MK. Huang J, et al. Elife. 2016 Oct 13;5:e21383. doi: 10.7554/eLife.21383. Elife. 2016. PMID: 27734801 Free PMC article.
References
Publication types
MeSH terms
Substances
LinkOut - more resources
Full Text Sources
Molecular Biology Databases


