Epigenome characterization at single base-pair resolution - PubMed (original) (raw)
Epigenome characterization at single base-pair resolution
Jorja G Henikoff et al. Proc Natl Acad Sci U S A. 2011.
Abstract
We have combined standard micrococcal nuclease (MNase) digestion of nuclei with a modified protocol for constructing paired-end DNA sequencing libraries to map both nucleosomes and subnucleosome-sized particles at single base-pair resolution throughout the budding yeast genome. We found that partially unwrapped nucleosomes and subnucleosome-sized particles can occupy the same position within a cell population, suggesting dynamic behavior. By varying the time of MNase digestion, we have been able to observe changes that reflect differential sensitivity of particles, including the eviction of nucleosomes. To characterize DNA-binding features of transcription factors, we plotted the length of each fragment versus its position in the genome, which defined the minimal protected region of each factor. This process led to the precise mapping of protected and exposed regions at and around binding sites, and also determination of the degree to which they are flanked by phased nucleosomes and subnucleosome-sized particles. Our protocol and mapping method provide a general strategy for epigenome characterization, including nucleosome phasing and dynamics, ATP-dependent nucleosome remodelers, and transcription factors, from a single-sequenced sample.
Conflict of interest statement
The authors declare no conflict of interest.
Figures
Fig. 1.
Paired-end sequencing maps small MNase-protected particles. (A) Size distributions of mapped paired-end reads displayed as raw counts. Agarose gel analysis of MNase time-point samples (Inset) showing DNA from whole nuclei, soluble chromatin, and the insoluble pellet, extracted from strain Sby5146 (derived from W303: MATa leu2-3,112 his3-11:pCUP1-GFP12-LacI12:HIS3 trp1-1:256lacO:TRP1 can1-100 ade2-1 Δlys2 Δbar1 cse4ΔKan ura3-1:pCse4-3×FLAG-CSE4 + 500 bp) after MNase digestion. The band at limiting mobility is likely to be undigested genomic DNA from ∼10% of cells that retained their cell walls intact, thus preventing MNase entry. (B) Alignment of read data around 5′ ORF ends showing that subnucleosomal particles (≤80 bp) are enriched where nucleosomes (>140 bp) are depleted.
Fig. 2.
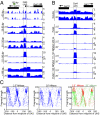
MNase protection landscape for a representative region of the genome. (A) Mapped paired-end reads were divided into five size categories, and occupancy landscapes were obtained by counting the number of reads in a size class spanning each base pair, measured as normalized counts on the y axis. Differences between the 2.5- and 20-min time points are most evident for the intermediate size classes. An intergenic region is expanded on the right. ORFs on the plus (+) strand are shown above the line and on the minus (–) strand are shown below. (B) Nuclear, soluble, and pellet DNA samples were sequenced and profiled. Normalized counts for all size classes combined are shown for the expanded region, with the full region displayed in
Fig. S2
.
Fig. 3.
MNase digestion causes nucleosome eviction and putative RSC enrichment over the Gal4 UAS ex vivo. (A) Subnucleosomal and nucleosomal profiles during MNase digestion of the well-studied Gal1-10 region. Note the square peak of the RSC-disrupted nucleosome most prominent in the 111- to 140-bp fraction. Both the maximum chromosome II RSC X-ChIP signal and the maximum 125-bp chromatin signal are located over the Gal4 UAS, which also includes a canonical RSC motif (box). See
Fig. S4
for comparison with profiles of cross-linked chromatin. (B) A subset of Gal4 UAS nucleosomes are insoluble. Chromatin landscapes showing all fragment sizes reveal high occupancy of the nucleosome over the Gal4 UAS in soluble chromatin after 2.5′ digestion, and this is replaced by subnucleosomal particles after 20′ digestion. Nevertheless, the pellet is strongly enriched for this nucleosome relative to the genome as a whole at both time points. This conclusion is confirmed by parsing the data into size classes, which shows that pellet enrichment is specific for the 111- to 140 bp size class. (C) V-plot of the 1-kb region surrounding the Gal4 UAS. See
Fig. S4_B_
for interpretation.
Fig. 4.
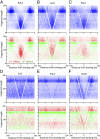
V-plot of the Abf1 transcription factor. (A) Map of the 400-bp region spanning Abf1 transcription-factor binding sites is shown, where data are combined for the 2.5- and 20-min time points (Upper, blue), and differentially colored (Lower, red for 2.5 min and green for 20 min). Orientation is based on alignment with the Abf1 consensus motif. (B) Schematic diagram illustrates how the map is interpreted. Fragments are indicated below the graph. A fragment that spans a protected region (first blue fragment) results in a dot placed in the central sector (vertical red arrow). The left diagonal results from fragments cleaved precisely on the right side of the protected region (second blue fragment), and likewise for the right diagonal. The minimal protected region is at the intersection of the diagonals on the y axis, and is also represented as the width of the gap on the x axis (extrapolation of the diagonal red lines to y = 0), which in the case of Abf1 is 20 bp. The open box represents a fragment that is not observed because its left end is protected from cleavage. The flanking triangle densities are produced by protected fragments that are near or adjacent to Abf1 but are cleaved in between.
Fig. 5.
V-plots of aligned transcription factor binding sites. See the legend to Fig. 4 for details (A–F) V-plots are shown for (A) Reb1, (B) Cbf1, (C) Rap1, (D) Sut1, (E) Pho2, and (F) Ume6. Similar V-plots were obtained for fragments from solubilized chromatin (
Fig. S7
).
Similar articles
- MPE-seq, a new method for the genome-wide analysis of chromatin structure.
Ishii H, Kadonaga JT, Ren B. Ishii H, et al. Proc Natl Acad Sci U S A. 2015 Jul 7;112(27):E3457-65. doi: 10.1073/pnas.1424804112. Epub 2015 Jun 15. Proc Natl Acad Sci U S A. 2015. PMID: 26080409 Free PMC article. - Epigenome Regulation by Dynamic Nucleosome Unwrapping.
Brahma S, Henikoff S. Brahma S, et al. Trends Biochem Sci. 2020 Jan;45(1):13-26. doi: 10.1016/j.tibs.2019.09.003. Epub 2019 Oct 17. Trends Biochem Sci. 2020. PMID: 31630896 Free PMC article. Review. - Mapping nucleosome positions using DNase-seq.
Zhong J, Luo K, Winter PS, Crawford GE, Iversen ES, Hartemink AJ. Zhong J, et al. Genome Res. 2016 Mar;26(3):351-64. doi: 10.1101/gr.195602.115. Epub 2016 Jan 15. Genome Res. 2016. PMID: 26772197 Free PMC article. - Subtracting the sequence bias from partially digested MNase-seq data reveals a general contribution of TFIIS to nucleosome positioning.
Gutiérrez G, Millán-Zambrano G, Medina DA, Jordán-Pla A, Pérez-Ortín JE, Peñate X, Chávez S. Gutiérrez G, et al. Epigenetics Chromatin. 2017 Dec 7;10(1):58. doi: 10.1186/s13072-017-0165-x. Epigenetics Chromatin. 2017. PMID: 29212533 Free PMC article. - Nucleosome positioning and spacing: from genome-wide maps to single arrays.
Baldi S. Baldi S. Essays Biochem. 2019 Apr 23;63(1):5-14. doi: 10.1042/EBC20180058. Print 2019 Apr 23. Essays Biochem. 2019. PMID: 31015380 Review.
Cited by
- High-resolution nucleosome mapping of targeted regions using BAC-based enrichment.
Yigit E, Zhang Q, Xi L, Grilley D, Widom J, Wang JP, Rao A, Pipkin ME. Yigit E, et al. Nucleic Acids Res. 2013 Apr;41(7):e87. doi: 10.1093/nar/gkt081. Epub 2013 Feb 14. Nucleic Acids Res. 2013. PMID: 23413004 Free PMC article. - Distinct chromosomal "niches" in the genome of Saccharomyces cerevisiae provide the background for genomic innovation and shape the fate of gene duplicates.
Stavropoulou A, Tassios E, Kalyva M, Georgoulopoulos M, Vakirlis N, Iliopoulos I, Nikolaou C. Stavropoulou A, et al. NAR Genom Bioinform. 2022 Nov 14;4(4):lqac086. doi: 10.1093/nargab/lqac086. eCollection 2022 Dec. NAR Genom Bioinform. 2022. PMID: 36381424 Free PMC article. - Hi-CO: 3D genome structure analysis with nucleosome resolution.
Ohno M, Ando T, Priest DG, Taniguchi Y. Ohno M, et al. Nat Protoc. 2021 Jul;16(7):3439-3469. doi: 10.1038/s41596-021-00543-z. Epub 2021 May 28. Nat Protoc. 2021. PMID: 34050337 - MNase titration reveals differences between nucleosome occupancy and chromatin accessibility.
Mieczkowski J, Cook A, Bowman SK, Mueller B, Alver BH, Kundu S, Deaton AM, Urban JA, Larschan E, Park PJ, Kingston RE, Tolstorukov MY. Mieczkowski J, et al. Nat Commun. 2016 May 6;7:11485. doi: 10.1038/ncomms11485. Nat Commun. 2016. PMID: 27151365 Free PMC article. - Determinants of nucleosome positioning and their influence on plant gene expression.
Liu MJ, Seddon AE, Tsai ZT, Major IT, Floer M, Howe GA, Shiu SH. Liu MJ, et al. Genome Res. 2015 Aug;25(8):1182-95. doi: 10.1101/gr.188680.114. Epub 2015 Jun 10. Genome Res. 2015. PMID: 26063739 Free PMC article.
References
- Noll M. Subunit structure of chromatin. Nature. 1974;251:249–251. - PubMed
Publication types
MeSH terms
Substances
LinkOut - more resources
Full Text Sources
Other Literature Sources
Molecular Biology Databases


