Formation of B-1 B cells from neonatal B-1 transitional cells exhibits NF-κB redundancy - PubMed (original) (raw)
Formation of B-1 B cells from neonatal B-1 transitional cells exhibits NF-κB redundancy
Encarnacion Montecino-Rodriguez et al. J Immunol. 2011.
Abstract
The stages of development leading up to the formation of mature B-1 cells have not been identified. As a result, there is no basis for understanding why various genetic defects, and those in the classical or alternative NF-κB pathways in particular, differentially affect the B-1 and B-2 B cell lineages. In this article, we demonstrate that B-1 B cells are generated from transitional cell intermediates that emerge in a distinct neonatal wave of development that is sustained for ~2 wk after birth and then declines as B-2 transitional cells predominate. We further show that, in contrast to the dependence of B-2 transitional cells on the alternative pathway, the survival of neonatal B-1 transitional cells and their maturation into B-1 B cells occurs as long as either alternative or classical NF-κB signaling is intact. On the basis of these results, we have generated a model of B-1 development that allows the defects in B-1 and B-2 cell production observed in various NF-κB-deficient strains of mice to be placed into a coherent cellular context.
Figures
FIGURE 1
Most sIgM+ B cells in neonatal SPL are immature transitional cells. A, Representative FACS analyses showing T1 and T2/T3 transitional, follicular (FO), marginal zone (MZ), and B-1 cells in the spleen (SPL) of 6 week and 5 day old SW mice. B, Age related changes in the relative frequency of B cell populations within sIgM+ cells in SPL. T1 and FO cells were defined according to their levels of sIgM and CD21 expression as illustrated in Supplementary Fig. 1 (on line). C, Representative FACS analyses of B-2, B-1a and B-1b cells in the peritoneal cavity (PerC) of 6 week and 5 day old SW mice. D, Age related changes in the relative frequency of B cell populations within sIgM+ cells in the PerC. n indicates the number of animals processed at the indicated time points. Average frequency and s.d. values for older animals are provided in Supplementary Table I (on line).
FIGURE 2
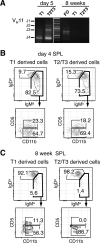
Neonatal T1 and T2/T3 cells preferentially mature into B-1 cells. A, Immunoglobulin Variable Heavy chain 11 (VH11) usage in T1, T2/T3 and FO cells isolated from 5 day and 8 week old SW mice. Representative FACS analyses of PerC cells from SCID mice transplanted with T1 and T2/T3 SPL cells isolated from 4 day (B) and 8 week old (C) donors. Plots show populations gated on donor sIgMa+ sIgDa+ cells.
FIGURE 3
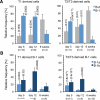
Age related changes in the B-1 potential of T1 and T2/T3 neonatal SPL cells. A, Relative frequency of B-1 and B-2 cells within donor sIgMa+ cells in the PerC of SCID mice transplanted with T1 and T2/T3 transitional cells isolated from the SPL of 5 and 12 days and 6 week old SW mice. B, Relative frequencies of B-1a and B-1b cells within the donor B-1 cells shown in panel (A). Note that neonatal transitional cells generate B-1a cells more efficiently than adult transitional cells. Differences in reconstitution between adult and neonatal populations were tested by two-tailed unpaired Student's t test (a=0.05), P values are indicated in parentheses. n indicates the number of animal tested at each time point. n indicates the number of recipients processed in each group.
FIGURE 4
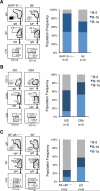
Distribution of B-1a, B-1b and B-2 cells in the PerC of adult BAFF-R–/–, XID and NF-κB1–/–Mice. Representative FACS analyses and relative frequency of B-1a, B-1b and B-2 cells in the PerC of BAFF-R—/— (A), XID (B) and NF-κB1—/— (C) mice are shown. n indicates the number of animals processed in each group.
FIGURE 5
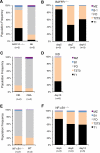
Neonatal B-1 Transitional Cells Emerge in BAFF-R—/—, XID and NF-kB1—/— Mice. Age related changes in the relative frequency of B cell populations within sIgM+ cells in the SPL of adult (A) and neonatal (B) BAFF-R—/— mice, adult (C) and neonatal (D) XID mice and adult (E) and neonatal (F) NF-kkB1—/—mice. n indicates the number of animals processed in each group. Average frequency and s.d. values for older animals are provided in Supplementary Table II (on line).
FIGURE 6
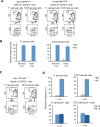
B-1 Transitional Cells From BAFF-R—/— and NF-κB1—/— Mice Mature into B-1 cells. A, Representative FACS analyses of the PerC cells from RAG-2/SJL mice transplanted with T1 and T2/T3 SPL cells from 5 day and 8 week old BAFF-R—/— donors. B, Relative frequency of B-1 and B-2 cells within donor CD45.2+ sIgM+ cells in the PerC of recipients of BAFF-R–/– transitional cells from 5 day (Neonates) and 8 week (Adults) old donors. C, Representative FACS analyses of the PerC cells from RAG-2/SJL mice transplanted with T1 and T2/T3 SPL cells from 7 day old NF-κB1—/— donors. D, B-1 and B-2 potential of 7 day old NF-kB1—/— T1 and T2/T3 SPL cells. The upper panel shows the frequency of B-1 and B-2 cells reconstituted and the lower panel shows the frequency of B-1a and B-1b cells within the B-1 populations in the upper panels. The data in all panels represent relative frequencies within donor CD45.2+ sIgM+ cells. n indicates the number of recipients processed in each group.
FIGURE 7
Model of layered B-1 and B-2 development. In a first neonatal wave, B-1 CLPs generate B-1 progenitors that in turn differentiate into immature B-1 cells. The latter cells then migrate to the SPL where they mature into B-1a and B-1b cells through B-1 transitional cell intermediates. In a second wave, B-2 CLPs generate immature B-2 cells that mature into B-2 transitional cells in the SPL. This B-2 transitional cell wave becomes predominant in the adult. Emergence of B-1 and B-2 transitional cells is blocked when both the classical and alternative NF-κB pathways are inactivated (Step 1). However, selective defects in one or the other pathway have differential effects on the formation of mature B-1 and B-2 cells. While the survival and maturation of B-2 transitional cells is dependent on alternative NF-κB signaling (step 2), B-1 transitional cells emerge and mature in the absence of these signals. The number of mature B-1 cells is reduced in mice with defects in classical NF-κB signaling. However, this does not compromise the emergence or maturation of B-1 transitional cells into B-1a or B-1b cells. Instead, classical signaling is required for maintenance of the mature B-1 pool, and for B-1a cells in particular, following their formation (step 3).
Similar articles
- Cell-autonomous role for NF-kappa B in immature bone marrow B cells.
Claudio E, Saret S, Wang H, Siebenlist U. Claudio E, et al. J Immunol. 2009 Mar 15;182(6):3406-13. doi: 10.4049/jimmunol.0803360. J Immunol. 2009. PMID: 19265118 Free PMC article. - Contrasting responses of lymphoid progenitors to canonical and noncanonical Wnt signals.
Malhotra S, Baba Y, Garrett KP, Staal FJ, Gerstein R, Kincade PW. Malhotra S, et al. J Immunol. 2008 Sep 15;181(6):3955-64. doi: 10.4049/jimmunol.181.6.3955. J Immunol. 2008. PMID: 18768850 Free PMC article. - B lymphocyte development in rabbit: progenitor B cells and waning of B lymphopoiesis.
Jasper PJ, Zhai SK, Kalis SL, Kingzette M, Knight KL. Jasper PJ, et al. J Immunol. 2003 Dec 15;171(12):6372-80. doi: 10.4049/jimmunol.171.12.6372. J Immunol. 2003. PMID: 14662835 - Plugging the leaky pre-B cell receptor.
Conley ME, Burrows PD. Conley ME, et al. J Immunol. 2010 Feb 1;184(3):1127-9. doi: 10.4049/jimmunol.0990113. J Immunol. 2010. PMID: 20089707 Review. No abstract available. - Fetal B-cell lymphopoiesis and the emergence of B-1-cell potential.
Dorshkind K, Montecino-Rodriguez E. Dorshkind K, et al. Nat Rev Immunol. 2007 Mar;7(3):213-9. doi: 10.1038/nri2019. Nat Rev Immunol. 2007. PMID: 17318232 Review.
Cited by
- B cell receptor-induced IL-10 production from neonatal mouse CD19+CD43- cells depends on STAT5-mediated IL-6 secretion.
Sakai J, Yang J, Chou CK, Wu WW, Akkoyunlu M. Sakai J, et al. Elife. 2023 Feb 3;12:e83561. doi: 10.7554/eLife.83561. Elife. 2023. PMID: 36735294 Free PMC article. - Shaping immunity for life: Layered development of CD8+ T cells.
Tabilas C, Smith NL, Rudd BD. Tabilas C, et al. Immunol Rev. 2023 May;315(1):108-125. doi: 10.1111/imr.13185. Epub 2023 Jan 18. Immunol Rev. 2023. PMID: 36653953 Free PMC article. Review. - Antibodies in action: the role of humoral immunity in the fight against atherosclerosis.
Taylor JA, Hutchinson MA, Gearhart PJ, Maul RW. Taylor JA, et al. Immun Ageing. 2022 Dec 2;19(1):59. doi: 10.1186/s12979-022-00316-6. Immun Ageing. 2022. PMID: 36461105 Free PMC article. Review. - Identification of novel B-1 transitional progenitors by B-1 lymphocyte fate-mapping transgenic mouse model Bhlhe41 dTomato-Cre.
Li H, Tang Y, Ren J, Bai R, Hu L, Jia W, Cao Y, Hong L, Xu M, Gao S, Shi Y, Pan S, Wang L, Zheng K, Zhao S, Wang H. Li H, et al. Front Immunol. 2022 Sep 15;13:946202. doi: 10.3389/fimmu.2022.946202. eCollection 2022. Front Immunol. 2022. PMID: 36189231 Free PMC article. - Neonatal Immune Responses to Respiratory Viruses.
Eddens T, Parks OB, Williams JV. Eddens T, et al. Front Immunol. 2022 Apr 14;13:863149. doi: 10.3389/fimmu.2022.863149. eCollection 2022. Front Immunol. 2022. PMID: 35493465 Free PMC article. Review.
References
- Chung J, Sillverman M, Monroe J. Transitional B cells: step by step towards immune competence. Trends Immunol. 2003;24:343–349. - PubMed
- Carsetti R, Rosado MM, Wardmann H. Peripheral development of B cells in mouse and man. Immunol. Rev. 2004;197:179–191. - PubMed
- Thomas M, Srivastava B, Allman D. Regulation of peripheral B cell maturation. Cell Immunol. 2006;239:92–102. - PubMed
- Martin F, Kearney JF. Marginal-zone B cells. Nat. Rev. Immunol. 2002;2:323–335. - PubMed
Publication types
MeSH terms
Substances
Grants and funding
- R37 AI021256-27/AI/NIAID NIH HHS/United States
- CA16042/CA/NCI NIH HHS/United States
- AI021256/AI/NIAID NIH HHS/United States
- R37 AI021256-25/AI/NIAID NIH HHS/United States
- R37 AI021256-24A2/AI/NIAID NIH HHS/United States
- R37 AI021256-26/AI/NIAID NIH HHS/United States
- R37 AI021256/AI/NIAID NIH HHS/United States
- P30 CA016042/CA/NCI NIH HHS/United States
- R01 AI021256/AI/NIAID NIH HHS/United States
LinkOut - more resources
Full Text Sources
Research Materials

