Plasma methoxytyramine: a novel biomarker of metastatic pheochromocytoma and paraganglioma in relation to established risk factors of tumour size, location and SDHB mutation status - PubMed (original) (raw)
Plasma methoxytyramine: a novel biomarker of metastatic pheochromocytoma and paraganglioma in relation to established risk factors of tumour size, location and SDHB mutation status
Graeme Eisenhofer et al. Eur J Cancer. 2012 Jul.
Abstract
Background: There are currently no reliable biomarkers for malignant pheochromocytomas and paragangliomas (PPGLs). This study examined whether measurements of catecholamines and their metabolites might offer utility for this purpose.
Methods: Subjects included 365 patients with PPGLs, including 105 with metastases, and a reference population of 846 without the tumour. Eighteen catecholamine-related analytes were examined in relation to tumour location, size and mutations of succinate dehydrogenase subunit B (SDHB).
Results: Receiver-operating characteristic curves indicated that plasma methoxytyramine, the O-methylated metabolite of dopamine, provided the most accurate biomarker for discriminating patients with and without metastases. Plasma methoxytyramine was 4.7-fold higher in patients with than without metastases, a difference independent of tumour burden and the associated 1.6- to 1.8-fold higher concentrations of norepinephrine and normetanephrine. Increased plasma methoxytyramine was associated with SDHB mutations and extra-adrenal disease, but was also present in patients with metastases without SDHB mutations or those with metastases secondary to adrenal tumours. High risk of malignancy associated with SDHB mutations reflected large size and extra-adrenal locations of tumours, both independent predictors of metastatic disease. A plasma methoxytyramine above 0.2nmol/L or a tumour diameter above 5cm indicated increased likelihood of metastatic spread, particularly when associated with an extra-adrenal location.
Conclusion: Plasma methoxytyramine is a novel biomarker for metastatic PPGLs that together with SDHB mutation status, tumour size and location provide useful information to assess the likelihood of malignancy and manage affected patients.
Copyright © 2011 Elsevier Ltd. All rights reserved.
Figures
Figure 1
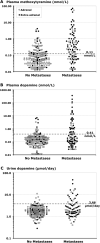
Dot plots showing normalized logarithmic distributions of plasma concentrations of methoxytyramine (panel A) and dopamine (panel B) and urinary outputs of dopamine (panel C) in patients with PPGLs according to presence or absence of metastases. Values for disease secondary to tumors with an exclusive adrenal location are illustrated by empty circles (○). Values for disease secondary to tumors with extra-adrenal locations are illustrated by solid circles (●). The dashed horizontal lines show the upper reference limits determined from 97.5 percentiles of the reference population, as indicated by the displayed values to the upper left of dashed lines in nmol/L (see also Table 1).
Figure 2
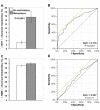
Comparative assessment of relative increases of plasma free methoxytyramine (MTY, A & B) and normetanephrine (NMN, C & D) as biomarkers for metastatic PPGLs. For this analysis mean±SE increases of methoxytyramine and normetanephrine above mean reference levels (from Table 1) are shown as percents of summed increases above reference for all three O-methylated metabolites (A & C). These relative increases, which are independent of tumor burden, indicate that increases in methoxytyramine represent only 2.9±0.8% of combined increases of all metabolites in patients without metastases, but 15.4±2.9% of the total in patients with metastases (A). In contrast, relative increases of plasma normetanephrine are similar in both groups (C). ROC curves, relating rates of true-positive (sensitivity) versus false-positive results (1-specificity) for relative increases of methoxytyramine (B) and normetanephrine (D) as biomarkers of metastatic disease, indicate significant diagnostic discriminatory power for methoxytyramine (P<0.0001), but lack of discriminatory power for normetanephrine (P=0.171).
Figure 3
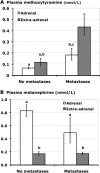
Bar graphs showing plasma concentrations of methoxytyramine (A) and metanephrine (B) in subgroups of patients with and without metastases according to adrenal versus extra-adrenal locations of primary tumors. Results are shown as geometric means±SE. a,b,cPresence of different alphabetic characters indicate significant differences (P<0.05) between groups, whereas presence of identical characters indicates lack of significant differences.
Figure 4
Bar graphs (means±SE) illustrating distinguishing characteristics of tumors due to SDHB mutations. Plasma concentrations of methoxytyramine and volumes of PPGLs in patients with and without SDHB mutations are shown sub-grouped according to presence of absence of metastases in panels A and B, whereas volumes of primary tumors according to adrenal and extra-adrenal locations are shown sub-grouped according to presence of absence of metastases in panel C. Tumor volumes, tissue concentrations of total catecholamines and percent contents of dopamine in patients with and without SDHB mutations are shown respectively in panels D, E and F. Data are restricted to patients with established mutations or in whom SDHB mutations were excluded by gene testing. Tumor volumes represent those for primary tumors. Data for tumor tissue catecholamines are from primary tumors resected from 11 patients with SDHB mutations (7 with distant metastases) and 145 without SDHB mutations. a,bDifferent alphabetic characters in upper panels indicate significant differences (P<0.05) between groups, whereas presence of identical characters indicates lack of a significant difference.
Figure 5
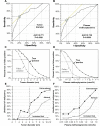
Analyses of tumor diameter (A,C,E) and plasma methoxytyramine (B,D,F) as predictors of metastatic disease. ROC curves relating changes in true-positive results (sensitivity) and false-positive results (1-specificity) for predicting the presence of malignancy as a function of changing cut-offs for mean tumor diameter are shown in panel A and for plasma methoxytyramine in panel B. Points of ROC curves closest to top left corners indicate values for true- and false-positive results used to estimate optimal cut-offs for tumor diameter in panel C and plasma methoxytyramine in panel D. Likelihoods of metastatic disease as a function of increasing tumor diameter in panel E and of increasing plasma methoxytyramine in panel F are shown separately for tumors with adrenal and extra-adrenal locations, assuming an overall frequency of malignancy of 10% for adrenal tumors and 36% for extra-adrenal tumors. Likelihoods of malignancy were then estimated based on differences in cumulative frequencies of tumors with and without metastases as a function of increasing mean diameter or plasma concentration of methoxytyramine.
Similar articles
- Plasma metanephrines and prospective prediction of tumor location, size and mutation type in patients with pheochromocytoma and paraganglioma.
Eisenhofer G, Deutschbein T, Constantinescu G, Langton K, Pamporaki C, Calsina B, Monteagudo M, Peitzsch M, Fliedner S, Timmers HJLM, Bechmann N, Fankhauser M, Nölting S, Beuschlein F, Stell A, Fassnacht M, Prejbisz A, Lenders JWM, Robledo M. Eisenhofer G, et al. Clin Chem Lab Med. 2020 Oct 1;59(2):353-363. doi: 10.1515/cclm-2020-0904. Clin Chem Lab Med. 2020. PMID: 33001846 - Measurements of plasma methoxytyramine, normetanephrine, and metanephrine as discriminators of different hereditary forms of pheochromocytoma.
Eisenhofer G, Lenders JW, Timmers H, Mannelli M, Grebe SK, Hofbauer LC, Bornstein SR, Tiebel O, Adams K, Bratslavsky G, Linehan WM, Pacak K. Eisenhofer G, et al. Clin Chem. 2011 Mar;57(3):411-20. doi: 10.1373/clinchem.2010.153320. Epub 2011 Jan 24. Clin Chem. 2011. PMID: 21262951 Free PMC article. - The size of the primary tumor and age at initial diagnosis are independent predictors of the metastatic behavior and survival of patients with SDHB-related pheochromocytoma and paraganglioma: a retrospective cohort study.
Schovanek J, Martucci V, Wesley R, Fojo T, Del Rivero J, Huynh T, Adams K, Kebebew E, Frysak Z, Stratakis CA, Pacak K. Schovanek J, et al. BMC Cancer. 2014 Jul 21;14:523. doi: 10.1186/1471-2407-14-523. BMC Cancer. 2014. PMID: 25048685 Free PMC article. - Metastatic pheochromocytoma and paraganglioma.
Angelousi A, Kassi E, Zografos G, Kaltsas G. Angelousi A, et al. Eur J Clin Invest. 2015 Sep;45(9):986-97. doi: 10.1111/eci.12495. Eur J Clin Invest. 2015. PMID: 26183460 Review. - Diagnosis of endocrine disease: Biochemical diagnosis of phaeochromocytoma and paraganglioma.
van Berkel A, Lenders JW, Timmers HJ. van Berkel A, et al. Eur J Endocrinol. 2014 Feb 4;170(3):R109-19. doi: 10.1530/EJE-13-0882. Print 2014 Mar. Eur J Endocrinol. 2014. PMID: 24347425 Review.
Cited by
- Reference intervals for plasma free metanephrines with an age adjustment for normetanephrine for optimized laboratory testing of phaeochromocytoma.
Eisenhofer G, Lattke P, Herberg M, Siegert G, Qin N, Därr R, Hoyer J, Villringer A, Prejbisz A, Januszewicz A, Remaley A, Martucci V, Pacak K, Ross HA, Sweep FC, Lenders JW. Eisenhofer G, et al. Ann Clin Biochem. 2013 Jan;50(Pt 1):62-9. doi: 10.1258/acb.2012.012066. Epub 2012 Oct 12. Ann Clin Biochem. 2013. PMID: 23065528 Free PMC article. - Local recurrence and metastatic disease in pheochromocytomas and sympathetic paragangliomas.
Araujo-Castro M, García Sanz I, Mínguez Ojeda C, Hanzu F, Mora M, Vicente A, Blanco Carrera C, de Miguel Novoa P, López García MDC, Lamas C, Manjón-Miguélez L, Del Castillo Tous M, Rodríguez de Vera P, Barahona San Millán R, Recasens M, Tomé Fernández-Ladreda M, Valdés N, Gracia Gimeno P, Robles Lazaro C, Michalopoulou T, Álvarez Escolá C, García Centeno R, Barca-Tierno V, Herrera-Martínez AD, Calatayud M. Araujo-Castro M, et al. Front Endocrinol (Lausanne). 2023 Dec 7;14:1279828. doi: 10.3389/fendo.2023.1279828. eCollection 2023. Front Endocrinol (Lausanne). 2023. PMID: 38155946 Free PMC article. - Recurrent Disease in Patients With Sporadic Pheochromocytoma and Paraganglioma.
Li M, Prodanov T, Meuter L, Kerstens MN, Bechmann N, Prejbisz A, Remde H, Timmers HJLM, Nölting S, Talvacchio S, Berends AMA, Fliedner S, Robledo M, Lenders JWM, Pacak K, Eisenhofer G, Pamporaki C. Li M, et al. J Clin Endocrinol Metab. 2023 Jan 17;108(2):397-404. doi: 10.1210/clinem/dgac563. J Clin Endocrinol Metab. 2023. PMID: 36190922 Free PMC article. - Metastatic pheochromocytoma and paraganglioma: signs and symptoms related to catecholamine secretion.
Li M, Pamporaki C, Fliedner SMJ, Timmers HJLM, Nölting S, Beuschlein F, Prejbisz A, Remde H, Robledo M, Bornstein SR, Lenders JWM, Eisenhofer G, Bechmann N. Li M, et al. Discov Oncol. 2021 Mar 19;12(1):9. doi: 10.1007/s12672-021-00404-x. Discov Oncol. 2021. PMID: 35201450 Free PMC article. - Metastatic Phaeochromocytoma: Spinning Towards More Promising Treatment Options.
Nölting S, Grossman A, Pacak K. Nölting S, et al. Exp Clin Endocrinol Diabetes. 2019 Feb;127(2-03):117-128. doi: 10.1055/a-0715-1888. Epub 2018 Sep 20. Exp Clin Endocrinol Diabetes. 2019. PMID: 30235495 Free PMC article. Review.
References
- Eisenhofer G, Bornstein SR, Brouwers FM, et al. Malignant pheochromocytoma: current status and initiatives for future progress. Endocr Relat Cancer. 2004 Sep;11(3):423–436. - PubMed
- Chrisoulidou A, Kaltsas G, Ilias I, Grossman AB. The diagnosis and management of malignant phaeochromocytoma and paraganglioma. Endocr Relat Cancer. 2007 Sep;14(3):569–585. - PubMed
- Brouwers FM, Petricoin EF, 3rd, Ksinantova L, et al. Low molecular weight proteomic information distinguishes metastatic from benign pheochromocytoma. Endocr Relat Cancer. 2005 Jun;12(2):263–272. - PubMed
- Strong VE, Kennedy T, Al-Ahmadie H, et al. Prognostic indicators of malignancy in adrenal pheochromocytomas: clinical, histopathologic, and cell cycle/apoptosis gene expression analysis. Surgery. 2008 Jun;143(6):759–768. - PubMed
Publication types
MeSH terms
Substances
Grants and funding
- Z01 BC011089-01/ImNIH/Intramural NIH HHS/United States
- Z01 BC011092-01/ImNIH/Intramural NIH HHS/United States
- Z01 BC011028-01/ImNIH/Intramural NIH HHS/United States
- Z01 BC011038-01/ImNIH/Intramural NIH HHS/United States
- Z01 HD008735/ImNIH/Intramural NIH HHS/United States
- Z01 HD008735-07/ImNIH/Intramural NIH HHS/United States
LinkOut - more resources
Full Text Sources
Medical


