LC-MS-based metabolomics - PubMed (original) (raw)
Review
LC-MS-based metabolomics
Bin Zhou et al. Mol Biosyst. 2012 Feb.
Abstract
Metabolomics aims at identification and quantitation of small molecules involved in metabolic reactions. LC-MS has enjoyed a growing popularity as the platform for metabolomic studies due to its high throughput, soft ionization, and good coverage of metabolites. The success of a LC-MS-based metabolomic study often depends on multiple experimental, analytical, and computational steps. This review presents a workflow of a typical LC-MS-based metabolomic analysis for identification and quantitation of metabolites indicative of biological/environmental perturbations. Challenges and current solutions in each step of the workflow are reviewed. The review intends to help investigators understand the challenges in metabolomic studies and to determine appropriate experimental, analytical, and computational methods to address these challenges.
Figures
Fig. 1
A typical workflow of a metabolomic study.
Fig. 2
Ranges of applicability of APPI, APCI and ESI.
Fig. 3
Preprocessing of a LC-MS dataset with 10 samples. The LC-MS raw data are first corrected for baseline effect, and then peak detection is performed on each EIC to detect the peak(s). For multiple samples peak alignment is used to correct for retention time drift. The peak list can be acquired after peak alignment for the dataset. Ion annotation is used to recognize the peaks originating from the same metabolite. The data are acquired using a UPLC-QTOF Premier instrument.
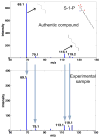
Fig.4
Metabolite ID verification by comparison of the MS2 spectrum of S-1-P (top) with experimental sample (bottom). The MS2 spectra are acquired with a precursor ion mass at 378 Da under negative ionization mode on a QSTAR Elite instrument.
Fig. 5
Illustration of absolute quantitation of metabolites by QqQ-based SRM using isotope dilution technique.(a) SRM detection of analyte and its isotope-labelled IS; (b) absolute quantitation of four analytes by SRM: correlating signal ratio of analyte and IS to its respective standard curve.
Similar articles
- MetaboLyzer: a novel statistical workflow for analyzing Postprocessed LC-MS metabolomics data.
Mak TD, Laiakis EC, Goudarzi M, Fornace AJ Jr. Mak TD, et al. Anal Chem. 2014 Jan 7;86(1):506-13. doi: 10.1021/ac402477z. Epub 2013 Nov 22. Anal Chem. 2014. PMID: 24266674 Free PMC article. - Current practice of liquid chromatography-mass spectrometry in metabolomics and metabonomics.
Gika HG, Theodoridis GA, Plumb RS, Wilson ID. Gika HG, et al. J Pharm Biomed Anal. 2014 Jan;87:12-25. doi: 10.1016/j.jpba.2013.06.032. Epub 2013 Jul 17. J Pharm Biomed Anal. 2014. PMID: 23916607 Review. - Liquid chromatography-mass spectrometric multiple reaction monitoring-based strategies for expanding targeted profiling towards quantitative metabolomics.
Guo B, Chen B, Liu A, Zhu W, Yao S. Guo B, et al. Curr Drug Metab. 2012 Nov;13(9):1226-43. doi: 10.2174/138920012803341401. Curr Drug Metab. 2012. PMID: 22519369 Review. - Mass spectrometry-based metabolomics of yeast.
Crutchfield CA, Lu W, Melamud E, Rabinowitz JD. Crutchfield CA, et al. Methods Enzymol. 2010;470:393-426. doi: 10.1016/S0076-6879(10)70016-1. Epub 2010 Mar 1. Methods Enzymol. 2010. PMID: 20946819 - Metabolomic Strategies Involving Mass Spectrometry Combined with Liquid and Gas Chromatography.
Lopes AS, Cruz EC, Sussulini A, Klassen A. Lopes AS, et al. Adv Exp Med Biol. 2017;965:77-98. doi: 10.1007/978-3-319-47656-8_4. Adv Exp Med Biol. 2017. PMID: 28132177 Review.
Cited by
- Metabolomics and Lipidomics: Expanding the Molecular Landscape of Exercise Biology.
Belhaj MR, Lawler NG, Hoffman NJ. Belhaj MR, et al. Metabolites. 2021 Mar 7;11(3):151. doi: 10.3390/metabo11030151. Metabolites. 2021. PMID: 33799958 Free PMC article. Review. - Application of metabolomics in drug resistant breast cancer research.
Shajahan-Haq AN, Cheema MS, Clarke R. Shajahan-Haq AN, et al. Metabolites. 2015 Feb 16;5(1):100-18. doi: 10.3390/metabo5010100. Metabolites. 2015. PMID: 25693144 Free PMC article. Review. - Application of untargeted liquid chromatography-mass spectrometry to routine analysis of food using three-dimensional bucketing and machine learning.
Hansen J, Kunert C, Münstermann H, Raezke KP, Seifert S. Hansen J, et al. Sci Rep. 2024 Jul 18;14(1):16594. doi: 10.1038/s41598-024-67459-y. Sci Rep. 2024. PMID: 39026016 Free PMC article. - Multi-Omics of Pine Wood Nematode Pathogenicity Associated With Culturable Associated Microbiota Through an Artificial Assembly Approach.
Cai S, Jia J, He C, Zeng L, Fang Y, Qiu G, Lan X, Su J, He X. Cai S, et al. Front Plant Sci. 2022 Jan 3;12:798539. doi: 10.3389/fpls.2021.798539. eCollection 2021. Front Plant Sci. 2022. PMID: 35046983 Free PMC article.
References
- Fiehn O. Plant Mol Biol. 2002;48:155–171. - PubMed
- Nicholson JK, Lindon JC, Holmes E. Xenobiotica. 1999;29:1181–1189. - PubMed
- Robertson DG. Toxicol Sci. 2005;85:809–822. - PubMed
- Khoo SH, Al-Rubeai M. Biotechnol Appl Biochem. 2007;47:71–84. - PubMed
- Goodacre R, Vaidyanathan S, Dunn WB, Harrigan GG, Kell DB. Trends Biotechnol. 2004;22:245–252. - PubMed
Publication types
MeSH terms
LinkOut - more resources
Full Text Sources
Other Literature Sources


