NF-κB–inducing kinase plays an essential T cell–intrinsic role in graft-versus-host disease and lethal autoimmunity in mice - PubMed (original) (raw)
NF-κB–inducing kinase plays an essential T cell–intrinsic role in graft-versus-host disease and lethal autoimmunity in mice
Susan E Murray et al. J Clin Invest. 2011 Dec.
Abstract
NF-κB–inducing kinase (NIK) is an essential upstream kinase in noncanonical NF-κB signaling. NIK-dependent NF-κB activation downstream of several TNF receptor family members mediates lymphoid organ development and B cell homeostasis. Peripheral T cell populations are normal in the absence of NIK, but the role of NIK during in vivo T cell responses to antigen has been obscured by other developmental defects in NIK-deficient mice. Here, we have identified a T cell–intrinsic requirement for NIK in graft-versus-host disease (GVHD), wherein NIK-deficient mouse T cells transferred into MHC class II mismatched recipients failed to cause GVHD. Although NIK was not necessary for antigen receptor signaling, it was absolutely required for costimulation through the TNF receptor family member OX40 (also known as CD134). When we conditionally overexpressed NIK in T cells, mice suffered rapid and fatal autoimmunity characterized by hyperactive effector T cells and poorly suppressive Foxp3(+) Tregs. Together, these data illuminate a critical T cell–intrinsic role for NIK during immune responses and suggest that its tight regulation is critical for avoiding autoimmunity.
Figures
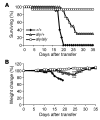
Figure 1. NIK-deficient CD4+ T cells do not cause lethal GVHD.
1 × 10⁶ naive +/+, aly/+, or aly/aly CD4+ T cells were injected intravenously into sublethally irradiated (H-2bm12×CD45.1)F1 recipients. (A) Survival is combined data from 4 independent experiments; each genotype was represented in 2–4 experiments. P < 0.05, +/+ versus aly/+ and_aly/+_ versus aly/aly; log-rank test. (1 mouse in the aly/aly group died only 4 days after transfer, which is much earlier than GVHD onset in this model). (B) Body weight data (± SEM) are representative of 2 independent experiments.
Figure 2. NIK-deficient CD4+ T cells respond normally to TCR signaling.
Sorted naive T cells (CD4+CD25–CD44lo) were stimulated with plate-bound anti-CD3 with (A–C) or without (B and C) anti-CD28. (A) Upregulation of OX40, CD69, and CD25 was assessed on day 2. Gray represents_Ox40–/–_ (for OX40) or_+/+_ unstimulated (for CD69 and CD25); thin line represents_+/+_ stimulated; bold line represents aly/aly stimulated. (B) Proliferation was measured by tritiated thymidine incorporation on days 3 and 4. (C) IL-2 was measured by ELISA of culture supernatants on days 3 and 4. Data (± SD) are representative of 1 (A) or 2 (B and C) independent experiments.
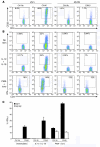
Figure 3. NIK-deficient CD4+ T cells do not respond to OX40 signaling.
7 × 10⁶ naive aly/aly or_aly/+_ CD4+ T cells were injected intravenously into unirradiated (H-2bm12×CD45.1)F1 recipients along with 50 μg agonist anti-OX40 or control antibody. Spleens were harvested 5 days later and stained immediately for CD25 (A) or stimulated for 5 hours with medium alone, IL-12 and IL-18, or PMA and ionomycin and then stained for intracellular IFN-γ (B and C). (A and B) Plots are gated on CD45.1– CD4+ (transferred) cells; numbers reflect percent CD25+ or IFN-γ+ gated cells. Data are representative of 3 mice per group in 1 representative experiment of 3. (C) Percent IFN-γ+ CD45.1– donor CD4+ T cells. Data (± SEM) are representative of 3 independent experiments.
Figure 4. OX40 activates canonical and noncanonical NF-κB pathways in CD4+ T cells, and the noncanonical pathway depends on NIK.
Purified naive CD4+ T cells were stimulated with anti-CD3 plus anti-CD28, and anti-OX40 or control antibody was added 48 hours later. (A and B) Whole-cell extracts were assessed for phosphorylated IκBα (pIκBα) and p100/p52 by Western blot. BD, below level of detection. In B, separated blots are from different gels run at the same time. Note the differing_y_ axis scales in the left and right graphs of B. (C) Nuclear extracts were assessed by EMSA with the indicated supershifting antibodies. Single asterisks denote c-Rel/RelA heterodimers and RelA homodimers; double asterisks denote nonspecific bands. For each set of panels (top, middle, bottom) all 8 lanes were run on the same gel but were noncontiguous. Data are representative of 2 independent experiments.
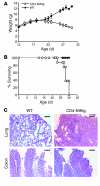
Figure 5. Overexpression of NIK in T cells causes lethal inflammation.
(A and B) CD4-NIKtg and age-matched littermate WT control mice were weighed and euthanized when moribund. Data in A show average weights (± SD) from 2 combined litters. (C) Sections of colon and lungs from moribund CD4-NIKtg and age-matched littermate WT control mice were assessed for leukocyte infiltrates by hematoxylin-eosin stain. Scale bars: 100 μm. Data are from 2 combined litters.
Figure 6. CD4-NIKtg mice have increased populations of activated T cells and nonfunctional Tregs.
(A–F) Organs were harvested from 11-day-old CD4-NIKtg (bold lines and white bars) and age-matched littermate WT control mice (narrow lines and black bars) and assessed for surface markers and intracellular Foxp3 by flow cytometry. (G–I) Naive CD4+ T cells and Tregs were sorted from 11-day-old CD4-NIKtg and littermate WT control spleens and LNs. Naive T cells were labeled with CFSE and cultured with WT APCs and soluble anti-CD3 at various ratios with Tregs. Gates inG indicate proportion of T cells that underwent at least 1 cell division. nd, not done. Data (± SD) are representative of 2 independent experiments. *P < 0.05.
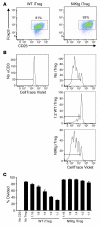
Figure 7. NIK intrinsically inhibits Treg-suppressive capacity and increases Tconv resistance to suppression.
CD4-NIKtg and littermate WT control Tregs and naive T cells were sorted from spleen and LN of healthy BM chimeras and cultured with CD45.1 Tregs or naive T cells plus WT APCs and soluble anti-CD3. (A) Naive T cells were labeled with CellTrace Violet to assess division over the course of 3 days. Gates indicate proportion of T cells that underwent at least 1 cell division. (B and C) Data (± SD) are representative of 2 independent experiments.
Figure 8. Acute overexpression of NIK in mature T cells inhibits iTreg suppressive capacity.
CD4+ T cells were magnetically purified from NIKtg and littermate WT control spleen and LN, treated with TAT-Cre, and cultured under iTreg-inducing conditions for 3 days. Tregs were then sorted on the basis of CD4, CD25, and GFP, and cultured with CD45.1 naive T cells plus WT APCs and soluble anti-CD3 for an additional 3 days. (A) After iTreg induction and sorting, WT and NIKtg iTregs expressed equivalent Foxp3 and CD25. Plots are gated on live T cells. Numbers reflect percent Foxp3+ T cells. (B) Naive CD45.1 CD4+ T cells were labeled with CellTrace Violet to assess division over the course of 3 days. (C) Data (± SD) are representative of 2 independent experiments.
Similar articles
- Cell-intrinsic role for NF-kappa B-inducing kinase in peripheral maintenance but not thymic development of Foxp3+ regulatory T cells in mice.
Murray SE. Murray SE. PLoS One. 2013 Sep 20;8(9):e76216. doi: 10.1371/journal.pone.0076216. eCollection 2013. PLoS One. 2013. PMID: 24073289 Free PMC article. - Cell intrinsic role of NF-κB-inducing kinase in regulating T cell-mediated immune and autoimmune responses.
Li Y, Wang H, Zhou X, Xie X, Chen X, Jie Z, Zou Q, Hu H, Zhu L, Cheng X, Brightbill HD, Wu LC, Wang L, Sun SC. Li Y, et al. Sci Rep. 2016 Feb 25;6:22115. doi: 10.1038/srep22115. Sci Rep. 2016. PMID: 26912039 Free PMC article. - Medullary thymic epithelial NF-kB-inducing kinase (NIK)/IKKα pathway shapes autoimmunity and liver and lung homeostasis in mice.
Shen H, Ji Y, Xiong Y, Kim H, Zhong X, Jin MG, Shah YM, Omary MB, Liu Y, Qi L, Rui L. Shen H, et al. Proc Natl Acad Sci U S A. 2019 Sep 17;116(38):19090-19097. doi: 10.1073/pnas.1901056116. Epub 2019 Sep 3. Proc Natl Acad Sci U S A. 2019. PMID: 31481626 Free PMC article. - Targeting NF-κB-Inducing Kinase (NIK) in Immunity, Inflammation, and Cancer.
Pflug KM, Sitcheran R. Pflug KM, et al. Int J Mol Sci. 2020 Nov 11;21(22):8470. doi: 10.3390/ijms21228470. Int J Mol Sci. 2020. PMID: 33187137 Free PMC article. Review. - NF-κB inducing kinase: a key regulator in the immune system and in cancer.
Thu YM, Richmond A. Thu YM, et al. Cytokine Growth Factor Rev. 2010 Aug;21(4):213-26. doi: 10.1016/j.cytogfr.2010.06.002. Epub 2010 Aug 3. Cytokine Growth Factor Rev. 2010. PMID: 20685151 Free PMC article. Review.
Cited by
- Dissecting the regulatory network of transcription factors in T cell phenotype/functioning during GVHD and GVT.
Harris R, Karimi M. Harris R, et al. Front Immunol. 2023 Jun 27;14:1194984. doi: 10.3389/fimmu.2023.1194984. eCollection 2023. Front Immunol. 2023. PMID: 37441063 Free PMC article. Review. - Opposing roles for TRAF1 in the alternative versus classical NF-κB pathway in T cells.
McPherson AJ, Snell LM, Mak TW, Watts TH. McPherson AJ, et al. J Biol Chem. 2012 Jun 29;287(27):23010-9. doi: 10.1074/jbc.M112.350538. Epub 2012 May 8. J Biol Chem. 2012. PMID: 22570473 Free PMC article. - NF-κB in inflammation and cancer.
Mao H, Zhao X, Sun SC. Mao H, et al. Cell Mol Immunol. 2025 Jun 25. doi: 10.1038/s41423-025-01310-w. Online ahead of print. Cell Mol Immunol. 2025. PMID: 40562870 Review. - Role of Nrf2 in Synaptic Plasticity and Memory in Alzheimer's Disease.
Davies DA, Adlimoghaddam A, Albensi BC. Davies DA, et al. Cells. 2021 Jul 25;10(8):1884. doi: 10.3390/cells10081884. Cells. 2021. PMID: 34440653 Free PMC article. Review. - NF-κB-inducing kinase maintains T cell metabolic fitness in antitumor immunity.
Gu M, Zhou X, Sohn JH, Zhu L, Jie Z, Yang JY, Zheng X, Xie X, Yang J, Shi Y, Brightbill HD, Kim JB, Wang J, Cheng X, Sun SC. Gu M, et al. Nat Immunol. 2021 Feb;22(2):193-204. doi: 10.1038/s41590-020-00829-6. Epub 2021 Jan 4. Nat Immunol. 2021. PMID: 33398181 Free PMC article.
References
- Watts T. TNF/TNFR family members in costimulation of T cell responses. Annu Rev Immunol. 2005;23:23–68. - PubMed
Publication types
MeSH terms
Substances
Grants and funding
- R21 AI077032/AI/NIAID NIH HHS/United States
- HL007781/HL/NHLBI NIH HHS/United States
- R01 GM071573/GM/NIGMS NIH HHS/United States
- WT_/Wellcome Trust/United Kingdom
- GM071573/GM/NIGMS NIH HHS/United States
- T32 HL007781/HL/NHLBI NIH HHS/United States
- AI077032/AI/NIAID NIH HHS/United States
- AI092080/AI/NIAID NIH HHS/United States
- R01 AI092080/AI/NIAID NIH HHS/United States
LinkOut - more resources
Full Text Sources
Other Literature Sources
Medical
Molecular Biology Databases
Research Materials
Miscellaneous


