PKA/AKAP1 and PP2A/Bβ2 regulate neuronal morphogenesis via Drp1 phosphorylation and mitochondrial bioenergetics - PubMed (original) (raw)
PKA/AKAP1 and PP2A/Bβ2 regulate neuronal morphogenesis via Drp1 phosphorylation and mitochondrial bioenergetics
Audrey S Dickey et al. J Neurosci. 2011.
Abstract
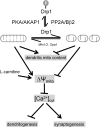
Mitochondrial shape is determined by fission and fusion reactions, perturbation of which can contribute to neuronal injury and disease. Mitochondrial fission is catalyzed by dynamin-related protein 1 (Drp1), a large GTPase of the dynamin family that is highly expressed in neurons and regulated by various posttranslational modifications, including phosphorylation. We report here that reversible phosphorylation of Drp1 at a conserved Ser residue by an outer mitochondrial kinase (PKA/AKAP1) and phosphatase (PP2A/Bβ2) impacts dendrite and synapse development in cultured rat hippocampal neurons. PKA/AKAP1-mediated phosphorylation of Drp1 at Ser656 increased mitochondrial length and dendrite occupancy, enhancing dendritic outgrowth but paradoxically decreasing synapse number and density. Opposing PKA/AKAP1, PP2A/Bβ2-mediated dephosphorylation of Drp1 at Ser656 fragmented and depolarized mitochondria and depleted them from dendrites, stunting dendritic outgrowth but augmenting synapse formation. Raising and lowering intracellular calcium reproduced the effects of dephospho-Drp1 and phospho-Drp1on dendrite and synapse development, respectively, while boosting mitochondrial membrane potential with l-carnitine-fostered dendrite at the expense of synapse formation without altering mitochondrial size or distribution. Thus, outer mitochondrial PKA and PP2A regulate neuronal development by inhibiting and promoting mitochondrial division, respectively. We propose that the bioenergetic state of mitochondria, rather than their localization or shape per se, is the key effector of Drp1, altering calcium homeostasis to modulate neuronal morphology and connectivity.
Figures
Figure 1.
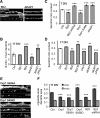
PKA/AKAP1 and phospho-Drp1 induce elongation, while PP2A/Bβ2 and dephospho-Drp1 induce fragmentation of mitochondria. A–C, Hippocampal neurons cotransfected at 12–13 DIV with mitochondria-localized GFP, and the indicated constructs were fixed and imaged 4 d later. Representative confocal images. (white: mitochondria) are shown in A. Morphology of dendritic mitochondria is quantified as aspect ratio and form factor in B (means ± SE of 4 experiments, 45+ neurons/condition), and as length in C (means ± SE of three experiments, 36+ neurons/condition). AKAP1 ΔPKA, I310P, L316P mutant; Bβ2M, RR168EE mutant; Ctrl, scrambled shRNA control; ***p < 0.001.
Figure 2.
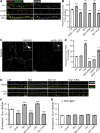
PP2A/Bβ2 and dephospho-Drp1 decrease, while PKA/AKAP1 and phospho-Drp1 increase dendritic mitochondria (mito) content. A–D, Hippocampal neurons cotransfected with mCherry, mitochondria-localized GFP, and other constructs were fixed and imaged at 7 (C) or 17 DIV (A, B, D). Representative confocal images of primary dendrites are shown in A. Dendritic mitochondria content (ratio of total mitochondria to total dendrite area) is quantified in C and D, while mitochondria number per unit of dendrite length is shown in B. E, F, Hippocampal neurons transfected with the indicated constructs (Drp1 S656A/S656D plasmids also knock down endogenous Drp1) were fixed at 17 DIV and stained for mitochondria (TOM20) and endosomes (EEA1). E shows representative images of primary dendrites, and F shows total mitochondria and endosome (endo) area over primary dendrite area. Bar graphs show means ± SE of three experiments with 45+ (B, D) and 36+ (C, F) neurons/condition; *p < 0.05, **p < 0.01, ***p < 0.001. Ctrl, Control.
Figure 3.
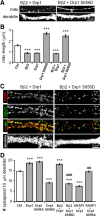
PKA/AKAP1 fosters while PP2A/Bβ2 retards dendrite outgrowth. A–E, Hippocampal neurons virally transduced at 0 or 7 DIV were fixed and labeled for MAP2B at 7 (A, E) or 17 DIV (A–D); representative images are shown in A. Dendrite complexity was quantified by Sholl analysis as the number of dendritic intersections with 25 μm-spaced concentric circles centered on the cell body (B, E) and by counting primary dendrites (C) and dendritic branch points per neuron (D). Bar graphs show means ± SE of 3–5 experiments with 36+ neurons/condition; *p < 0.05, **p < 0.01, ***p < 0.001. Ctrl, Control.
Figure 4.
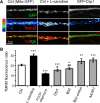
Mitochondrial fission promotes activity-dependent synapse formation. A–G, HC neurons were virally transduced at 3 DIV and fixed at 17–18 DIV. In G, excitatory neurotransmission was blocked with TTX (1 μ
m
) and APV (100 μ
m
) throughout this period. Synapses were identified by immunolabeling for presynaptic and postsynaptic markers, bassoon/F-actin (A–D) and vGluT1/PSD95 (E, F), and regions of overlap (A, D, E, F) or presynaptic puncta (C, D) were counted by automated image analysis. Numbers of presynaptic, postsynaptic, and overlap puncta were essentially identical for each neuron. Representative confocal images of primary dendrites (A, E) and full dendritic arbors (C) are shown. Synapse density (number per 10 μm primary dendrite) is plotted in B, F, G, while total synapse number (per 150 × 150 μm visual field) is shown in D as means ± SE of 3–4 experiments with 36+ neurons/condition; *p < 0.05, **p < 0.01, ***p < 0.001, compared to control (Ctrl).
Figure 5.
PP2A/Bβ2 and PKA/AKAP1 act through (de)phosphorylation of Drp1 at Ser656. A–D, Hippocampal neurons transfected at 13 DIV were fixed at 18 DIV and immunolabeled for mitochondria (mito, TOM20; A, B) or glutamatergic synapses (vGluT1 + PSD95, C, D). Representative confocal images of primary dendrites are shown in A and C, while mitochondrial length and synapse density are plotted in B and D, respectively, as means ± SE of three experiments with 36+ neurons/condition; *p < 0.05, **p < 0.01, ***p < 0.001, compared to control (Ctrl); ##p < 0.1, ###p < 0.001, compared to AKAP1/Bβ2 + Drp1.
Figure 6.
Mitochondrial fission/fusion determines mitochondrial membrane potential. A, B, Hippocampal neurons virally transduced at 12 DIV with GFP or the indicated GFP fusion proteins were labeled with 20 n
m
TMRM and imaged live by confocal microscopy at 18 DIV. FCCP/oligomycin (0.5 μ
m
/2 μ
m
) and
l
-carnitine (1 m
m
) were added 10 min before imaging. A, Representative images of primary dendrites with TMRM fluorescence intensity shown on a pseudocolor scale. B, Relative mitochondrial membrane potential was expressed as the ratio of background-subtracted TMRM fluorescence in mitochondria over the adjacent dendritic cytosol and plotted as means ± SE of 3–6 experiments with 36–65 neurons/condition; *p < 0.05, **p < 0.01, ***p < 0.001 compared to control (Ctrl; GFP) and #p < 0.05, ##p < 0.01 compared to FCCP/oligomycin.
Figure 7.
Calcium inhibits dendritogenesis. A–D , Hippocampal neurons were cultured in the presence of elevated calcium (2.3 m
m
), the L-type Ca2+ channel agonist Bay K8466 (50 n
m
), or the cell-permeant calcium chelator BAPTA-AM (10 μ
m
) and fixed and stained for MAP2B at 15 or 19 DIV as indicated. Representative epifluorescence images are shown in A and C, while results from Sholl analyses are plotted in B and D as means ± SE of three experiments with 36+ neurons/condition; ***p < 0.001.
Figure 8.
l
-Carnitine phenocopies mitochondrial fusion effects on dendrite and synapse development. A–H, At 12 DIV, hippocampal neurons were virally transduced with GFP or Bβ2-GFP and treated with or without
l
-carnitine (LC) (1 m
m
) starting at 13 DIV. At 18 DIV, cultures were fixed and stained for mitochondria (mito, TOM20; A --C), dendrites (MAP2B; D, E), and synapses (PSD95, F–H). Shown are representative images (A, D, F) and quantification of mitochondrial length (B), dendritic mitochondria content (C), dendrite complexity (E), synapse number (within a 318 × 318 μm visual field; G), and synapse density (H) plotting; means ± SE of three experiments with 36+ neurons/condition; ***p < 0.001 compared to untreated controls (Ctrl); ###p < 0.001 compared to Bβ2.
Figure 9.
Model. Reversible phosphorylation of Drp1 at Ser656 by PKA/AKAP1 and PP2A/Bβ2 regulates neuronal development through mitochondrial (mito) membrane potential and calcium sequestration. See Discussion for details.
Similar articles
- N-terminal phosphorylation of protein phosphatase 2A/Bβ2 regulates translocation to mitochondria, dynamin-related protein 1 dephosphorylation, and neuronal survival.
Merrill RA, Slupe AM, Strack S. Merrill RA, et al. FEBS J. 2013 Jan;280(2):662-73. doi: 10.1111/j.1742-4658.2012.08631.x. Epub 2012 Jun 8. FEBS J. 2013. PMID: 22583914 Free PMC article. - Deletion of a Neuronal Drp1 Activator Protects against Cerebral Ischemia.
Flippo KH, Lin Z, Dickey AS, Zhou X, Dhanesha NA, Walters GC, Liu Y, Merrill RA, Meller R, Simon RP, Chauhan AK, Usachev YM, Strack S. Flippo KH, et al. J Neurosci. 2020 Apr 8;40(15):3119-3129. doi: 10.1523/JNEUROSCI.1926-19.2020. Epub 2020 Mar 6. J Neurosci. 2020. PMID: 32144179 Free PMC article. - Mechanism of neuroprotective mitochondrial remodeling by PKA/AKAP1.
Merrill RA, Dagda RK, Dickey AS, Cribbs JT, Green SH, Usachev YM, Strack S. Merrill RA, et al. PLoS Biol. 2011 Apr;9(4):e1000612. doi: 10.1371/journal.pbio.1000612. Epub 2011 Apr 19. PLoS Biol. 2011. PMID: 21526220 Free PMC article. - Mitochondria: a kinase anchoring protein 1, a signaling platform for mitochondrial form and function.
Merrill RA, Strack S. Merrill RA, et al. Int J Biochem Cell Biol. 2014 Mar;48:92-6. doi: 10.1016/j.biocel.2013.12.012. Epub 2014 Jan 8. Int J Biochem Cell Biol. 2014. PMID: 24412345 Free PMC article. Review. - A-Kinase Anchoring Protein 1: Emerging Roles in Regulating Mitochondrial Form and Function in Health and Disease.
Liu Y, Merrill RA, Strack S. Liu Y, et al. Cells. 2020 Jan 26;9(2):298. doi: 10.3390/cells9020298. Cells. 2020. PMID: 31991888 Free PMC article. Review.
Cited by
- Mechanisms and roles of mitochondrial localisation and dynamics in neuronal function.
Seager R, Lee L, Henley JM, Wilkinson KA. Seager R, et al. Neuronal Signal. 2020 Jun 1;4(2):NS20200008. doi: 10.1042/NS20200008. eCollection 2020 Jun. Neuronal Signal. 2020. PMID: 32714603 Free PMC article. Review. - Role of protein kinase A in regulating mitochondrial function and neuronal development: implications to neurodegenerative diseases.
Dagda RK, Das Banerjee T. Dagda RK, et al. Rev Neurosci. 2015;26(3):359-70. doi: 10.1515/revneuro-2014-0085. Rev Neurosci. 2015. PMID: 25741943 Free PMC article. Review. - Pim-1 kinase protects the liver from ischemia reperfusion injury by regulating dynamics-related protein 1.
Sun YD, Xu QG, Dai DS, Wang SX, Li XQ, Shi SH, Jiang P, Jin Y, Wang X, Zhang Y, Wang F, Liu P, Zhang BL, Li TX, Xu CS, Wu B, Cai JZ. Sun YD, et al. iScience. 2024 Jun 28;27(7):110280. doi: 10.1016/j.isci.2024.110280. eCollection 2024 Jul 19. iScience. 2024. PMID: 39055921 Free PMC article. - Lack of the immune adaptor molecule SARM1 accelerates disease in prion infected mice and is associated with increased mitochondrial respiration and decreased expression of NRF2.
Ward A, Jessop F, Faris R, Shoup D, Bosio CM, Peterson KE, Priola SA. Ward A, et al. PLoS One. 2022 May 4;17(5):e0267720. doi: 10.1371/journal.pone.0267720. eCollection 2022. PLoS One. 2022. PMID: 35507602 Free PMC article. - Adrenergic Regulation of Drp1-Driven Mitochondrial Fission in Cardiac Physio-Pathology.
Jhun BS, O-Uchi J, Adaniya SM, Cypress MW, Yoon Y. Jhun BS, et al. Antioxidants (Basel). 2018 Dec 18;7(12):195. doi: 10.3390/antiox7120195. Antioxidants (Basel). 2018. PMID: 30567380 Free PMC article. Review.
References
- Adams I, Jones DG. Quantitative ultrastructural changes in rat cortical synapses during early-, mid- and late-adulthood. Brain Res. 1982;239:349–363. - PubMed
- Affaitati A, Cardone L, de Cristofaro T, Carlucci A, Ginsberg MD, Varrone S, Gottesman ME, Avvedimento EV, Feliciello A. Essential role of A-kinase anchor protein 121 for cAMP signaling to mitochondria. J Biol Chem. 2003;278:4286–4294. - PubMed
- Andres RH, Ducray AD, Schlattner U, Wallimann T, Widmer HR. Functions and effects of creatine in the central nervous system. Brain Res Bull. 2008;76:329–343. - PubMed
- Bremer J. Carnitine–metabolism and functions. Physiol Rev. 1983;63:1420–1480. - PubMed
Publication types
MeSH terms
Substances
Grants and funding
- R01 NS057714/NS/NINDS NIH HHS/United States
- R01 NS043254/NS/NINDS NIH HHS/United States
- R01 NS056244-05/NS/NINDS NIH HHS/United States
- NS057714/NS/NINDS NIH HHS/United States
- R01 NS056244/NS/NINDS NIH HHS/United States
- NS056244/NS/NINDS NIH HHS/United States
- R56 NS056244/NS/NINDS NIH HHS/United States
- NS043254/NS/NINDS NIH HHS/United States
- R01 NS057714-02/NS/NINDS NIH HHS/United States
- R01 NS043254-09/NS/NINDS NIH HHS/United States
LinkOut - more resources
Full Text Sources
Other Literature Sources
Molecular Biology Databases
Research Materials
Miscellaneous

