Untuned suppression makes a major contribution to the enhancement of orientation selectivity in macaque v1 - PubMed (original) (raw)
Untuned suppression makes a major contribution to the enhancement of orientation selectivity in macaque v1
Dajun Xing et al. J Neurosci. 2011.
Abstract
One of the functions of the cerebral cortex is to increase the selectivity for stimulus features. Finding more about the mechanisms of increased cortical selectivity is important for understanding how the cortex works. Up to now, studies in multiple cortical areas have reported that suppressive mechanisms are involved in feature selectivity. However, the magnitude of the contribution of suppression to tuning selectivity is not yet determined. We use orientation selectivity in macaque primary visual cortex, V1, as an archetypal example of cortical feature selectivity and develop a method to estimate the magnitude of the contribution of suppression to orientation selectivity. The results show that untuned suppression, one form of cortical suppression, decreases the orthogonal-to-preferred response ratio (O/P ratio) of V1 cells from an average of 0.38 to 0.26. Untuned suppression has an especially large effect on orientation selectivity for highly selective cells (O/P < 0.2). Therefore, untuned suppression is crucial for the generation of highly orientation-selective cells in V1 cortex.
Figures
Figure 1.
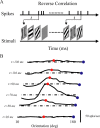
Dynamic orientation tuning measured by reverse correlation. A, The reverse correlation method. Stimuli with different orientations plus a blank were flashed for 20 ms in a random sequence. The spike time of each cell was recorded with 1 ms resolution. B, Dynamics of orientation tuning of an example cell. Tuning curves are plotted every 20 ms, starting at 30 ms after stimulus onset and ending at 130 ms after stimulus onset. The red points represent the responses of cells to orientation at 90° (preferred orientation) and blue points are the responses of cells to orientation at 180° (orthogonal to preferred). For convenience, the tuning curves of each cell were shifted by a fixed value, so that its preferred orientation is ∼90°. The dash-dot lines in B represent the responses of cells to blank stimulus.
Figure 2.
Plan of experiments. Using reverse correlation with dynamically presented gratings (Fig. 1), we estimated tuned enhancement and untuned suppression (Fig. 4). Next, we summed the dynamic responses over time and fed the integrated response in to a threshold-rate model. Finally, the untuned suppression estimate for each single neuron was subtracted from the dynamics and then the drifting grating response recalculated. Comparison of orientation selectivity with and without untuned suppression provided quantitative estimates of how much untuned suppression contributed to selectivity on a neuron-by-neuron basis.
Figure 3.
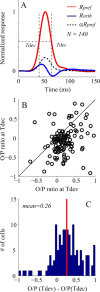
Dynamic responses in V1. A, Population averaged dynamic responses to their preferred orientations (_R_pref, red curve) compared with dynamic responses to their orthogonal orientations (_R_orth, blue curve) for V1 cells. The dashed curve is a rescaled version of _R_pref by α (=0.27) to match the early part of _R_orth. The intersections of vertical lines and horizontal line represent _T_dev and _T_dec. B, Scatter plot of O/P ratio (ratio of _R_orth to _R_pref) for individual V1 cells, at _T_dev and _T_dec. C, The distribution of the difference of O/P ratio between _T_dev and _T_dec. In C, the red vertical line represents the mean difference of O/P.
Figure 4.
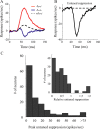
Untuned suppression is needed to model the dynamic orientation tuning for individual V1 cells. A shows the time courses of _R_pref (red curves) and _R_orth (blue curves) from a V1 cell. Both _R_orth and _R_pref have positive responses at early time. At early time (before 45 ms after stimulus onset), _R_orth has a time course similar to _R_pref but is rescaled by α, 0.48 (dashed curve). At later times, the blue and dashed curves are different because of untuned suppression. B shows estimated untuned suppression for this cell. C, Population distribution of the estimated peak values of U(t) for all the cells in the population. The inset shows the distribution of the peak untuned suppression relative to the peak response to the preferred orientation.
Figure 5.
Estimation of the operating point of a representative V1 cell and a comparison of measured and predicted orientation tuning. A, The operating point of the V1 cell. The red curve is fitted by a power law K_〈_R_rvc(θ) − Th〉_n (K = 248 spikes/s, Th = −0.19, and n = 1.6). B, The distribution of the exponent n of the power law for all V1 cells. C, The distribution of threshold Th for all V1 cells.
Figure 6.
Peak firing rates predicted by dynamic responses versus those measured by drifting gratings. A, Scatter plot of the predicted peak firing rates of V1 cells (_x_-axis) versus those measured by drifting gratings (_y_-axis). The predicted and measured rates are highly correlated (r = 0.68). B, Scatter plot of the measured peak firing rates of V1 cells measured by drifting gratings (_x_-axis) versus peak responses measured by reverse correlation experiments (_y_-axis). C, Scatter plot of the estimated power n of V1 cells (_x_-axis) versus ratio of peak responses measured by reverse correlation experiments and drifting grating experiments. The dashed lines in A and B represent identity lines.
Figure 7.
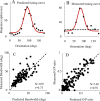
Orientation tuning predicted by dynamic responses versus those measured by drifting gratings. A, An example of a single neuron (the same neuron as in Fig. 5_A_). The orientation tuning curve of the cell predicted from the power law function derived from Figure 5_A_. B, For the same V1 cell, the orientation tuning curve was also measured by drifting gratings. The dashed line in B represents the spontaneous firing rate. C, Scatter plot of the predicted orientation bandwidths of V1 cells (_x_-axis) versus those measured by drifting gratings (_y_-axis). D, Comparison of predicted versus measured O/P ratio shown by a scatter plot of O/P ratio predicted by reverse correlation experiments (_x_-axis) and O/P ratio measured with drifting gratings (_y_-axis). Correlation coefficients were as follows: 0.73 for bandwidth, 0.91 for O/P ratio.
Figure 8.
The effect of untuned suppression on O/P ratio estimated across the V1 population. A, Distribution of the measured O/P ratio of V1 cells from experiments with drifting gratings as stimuli. B, Distribution of the O/P ratio of V1 cells estimated from dynamics experiments that include untuned suppression. C, Distribution of the O/P ratio of V1 cells without untuned suppression, estimated from dynamics experiments. D, A scatter plot for N = 140 cells recorded in V1 of predicted O/P ratio (_x_-axis) versus O/P ratio without untuned suppression (_y_-axis). The distance of each point from the unit line, drawn as the diagonal, is the amount untuned suppression contributed to orientation selectivity.
Figure 9.
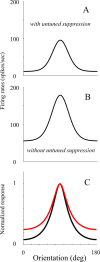
Change of orientation tuning curves with removal of untuned suppression. A and B show the change of the orientation tuning curve of an example cell, before and after its untuned suppression was removed. C, The population (cells with O/P < 0.2) averaged orientation tuning (black curve; O/P = 0.08) compared with the population average orientation tuning without untuned suppression (red curve; O/P = 0.25).
Figure 10.
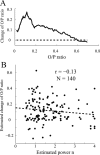
A, Untuned suppression has stronger effects on sharply tuned V1 cells. The graph shows the predicted change of O/P ratio caused by removing untuned suppression (_y_-axis) plotted versus the measured O/P ratio of V1 cells (_x_-axis). The biggest effects are at low O/P ratios (most highly selective cells). B, Untuned suppression is not significantly correlated to estimated exponent n in the V1 population. The graph shows the predicted change of O/P ratio caused by removing untuned suppression (_y_-axis) plotted versus the estimated exponent n of V1 cells (_x_-axis). The correlation is not significant (p = 0.125).
Similar articles
- Effect of stimulus size on the dynamics of orientation selectivity in Macaque V1.
Xing D, Shapley RM, Hawken MJ, Ringach DL. Xing D, et al. J Neurophysiol. 2005 Jul;94(1):799-812. doi: 10.1152/jn.01139.2004. Epub 2005 Feb 23. J Neurophysiol. 2005. PMID: 15728763 - Local circuit inhibition in the cerebral cortex as the source of gain control and untuned suppression.
Shapley RM, Xing D. Shapley RM, et al. Neural Netw. 2013 Jan;37:172-81. doi: 10.1016/j.neunet.2012.09.005. Epub 2012 Sep 20. Neural Netw. 2013. PMID: 23036513 Free PMC article. - Suppression of neural responses to nonoptimal stimuli correlates with tuning selectivity in macaque V1.
Ringach DL, Bredfeldt CE, Shapley RM, Hawken MJ. Ringach DL, et al. J Neurophysiol. 2002 Feb;87(2):1018-27. doi: 10.1152/jn.00614.2001. J Neurophysiol. 2002. PMID: 11826065 - Dynamics of orientation selectivity in the primary visual cortex and the importance of cortical inhibition.
Shapley R, Hawken M, Ringach DL. Shapley R, et al. Neuron. 2003 Jun 5;38(5):689-99. doi: 10.1016/s0896-6273(03)00332-5. Neuron. 2003. PMID: 12797955 Review. - The dynamics of visual responses in the primary visual cortex.
Shapley R, Hawken M, Xing D. Shapley R, et al. Prog Brain Res. 2007;165:21-32. doi: 10.1016/S0079-6123(06)65003-6. Prog Brain Res. 2007. PMID: 17925238 Review.
Cited by
- Stable learning of functional maps in self-organizing spiking neural networks with continuous synaptic plasticity.
Srinivasa N, Jiang Q. Srinivasa N, et al. Front Comput Neurosci. 2013 Feb 27;7:10. doi: 10.3389/fncom.2013.00010. eCollection 2013. Front Comput Neurosci. 2013. PMID: 23450808 Free PMC article. - Dynamics and Mechanisms of Contrast-Dependent Modulation of Spatial-Frequency Tuning in the Early Visual Cortex.
Tanaka H, Sawada R. Tanaka H, et al. J Neurosci. 2022 Sep 14;42(37):7047-7059. doi: 10.1523/JNEUROSCI.2086-21.2022. Epub 2022 Aug 4. J Neurosci. 2022. PMID: 35927035 Free PMC article. - Cholinergic suppression of visual responses in primate V1 is mediated by GABAergic inhibition.
Disney AA, Aoki C, Hawken MJ. Disney AA, et al. J Neurophysiol. 2012 Oct;108(7):1907-23. doi: 10.1152/jn.00188.2012. Epub 2012 Jul 11. J Neurophysiol. 2012. PMID: 22786955 Free PMC article. - Broadening of inhibitory tuning underlies contrast-dependent sharpening of orientation selectivity in mouse visual cortex.
Li YT, Ma WP, Li LY, Ibrahim LA, Wang SZ, Tao HW. Li YT, et al. J Neurosci. 2012 Nov 14;32(46):16466-77. doi: 10.1523/JNEUROSCI.3221-12.2012. J Neurosci. 2012. PMID: 23152629 Free PMC article. - The mechanism of orientation selectivity in primary visual cortex without a functional map.
Hansel D, van Vreeswijk C. Hansel D, et al. J Neurosci. 2012 Mar 21;32(12):4049-64. doi: 10.1523/JNEUROSCI.6284-11.2012. J Neurosci. 2012. PMID: 22442071 Free PMC article.
References
- Anderson JS, Carandini M, Ferster D. Orientation tuning of input conductance, excitation, and inhibition in cat primary visual cortex. J Neurophysiol. 2000;84:909–926. - PubMed
- Anzai A, Ohzawa I, Freeman RD. Neural mechanisms for processing binocular information. I. Simple cells. J Neurophysiol. 1999;82:891–908. - PubMed
- Bonds AB. Role of inhibition in the specification of orientation selectivity of cells in the cat striate cortex. Vis Neurosci. 1989;2:41–55. - PubMed
Publication types
MeSH terms
Grants and funding
- EY01472/EY/NEI NIH HHS/United States
- EY08300/EY/NEI NIH HHS/United States
- R01 EY008300/EY/NEI NIH HHS/United States
- EY018322/EY/NEI NIH HHS/United States
- EY12816/EY/NEI NIH HHS/United States
- R01 EY012816/EY/NEI NIH HHS/United States
- R01 EY001472/EY/NEI NIH HHS/United States
- R01 EY018322/EY/NEI NIH HHS/United States
LinkOut - more resources
Full Text Sources
Miscellaneous
