Hypoxia-inducible factor 1-mediated human GATA1 induction promotes erythroid differentiation under hypoxic conditions - PubMed (original) (raw)
Hypoxia-inducible factor 1-mediated human GATA1 induction promotes erythroid differentiation under hypoxic conditions
Feng-Lin Zhang et al. J Cell Mol Med. 2012 Aug.
Abstract
Hypoxia-inducible factor promotes erythropoiesis through coordinated cell type-specific hypoxia responses. GATA1 is essential to normal erythropoiesis and plays a crucial role in erythroid differentiation. In this study, we show that hypoxia-induced GATA1 expression is mediated by HIF1 in erythroid cells. Under hypoxic conditions, significantly increased GATA1 mRNA and protein levels were detected in K562 cells and erythroid induction cultures of CD34(+) haematopoietic stem/progenitor cells. Enforced HIF1α expression increased GATA1 expression, while HIF1α knockdown by RNA interference decreased GATA1 expression. In silico analysis revealed one potential hypoxia response element (HRE). The results from reporter gene and mutation analysis suggested that this element is necessary for hypoxic response. Chromatin immunoprecipitation (ChIP)-PCR showed that the putative HRE was recognized and bound by HIF1 in vivo. These results demonstrate that the up-regulation of GATA1 during hypoxia is directly mediated by HIF1.The mRNA expression of some erythroid differentiation markers was increased under hypoxic conditions, but decreased with RNA interference of HIF1α or GATA1. Flow cytometry analysis also indicated that hypoxia, desferrioxamine or CoCl(2) induced expression of erythroid surface markers CD71 and CD235a, while expression repression of HIF1α or GATA1 by RNA interference led to a decreased expression of CD235a. These results suggested that HIF1-mediated GATA1 up-regulation promotes erythropoiesis in order to satisfy the needs of an organism under hypoxic conditions.
© 2011 The Authors Journal of Cellular and Molecular Medicine © 2011 Foundation for Cellular and Molecular Medicine/Blackwell Publishing Ltd.
Figures
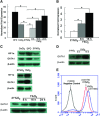
Fig 1
Induction of GATA1 gene expression under hypoxia. (A) Real-time PCR analysis of GATA1 mRNA expression (mean ± S.E.M.) in K562 cells that were cultured with 100 μM DFO or CoCl2, or under normoxia (21% O2) or hypoxia (1% O2). (B) Real-time PCR analysis of GATA1 mRNA expression (mean ± S.E.M.) in CD34+ erythroid cultures. *P < 0.01. (C) Western blot assay of HIF1α, GATA1 and β-actin protein expression in K562 cells cultured in 100 μM DFO or CoCl2, or under normoxia (21% O2), or hypoxia (1% O2) for 36 hrs or indicated time. (D) Western blot assay of GATA1 and β-actin protein expression in CD34+ erythroid cultures. The UCB-derived CD34+ cells were cultured in erythroid induction culture medium for 4 days and then were exposed to 21% O2 (normoxia) for 16 hrs or 1% O2 (hypoxia) for the indicated hours. (E) Flow cytometry analysis of GATA1 protein expression in K562 cells that were cultured under normoxia (21% O2) or hypoxia (1% O2) for 36 hrs. After being fixed and permeated, the cells were incubated with unconjugated primary antibody, and then with fluorochrome-conjugated secondary antibody. As a negative control, cells were incubated only with secondary antibody.
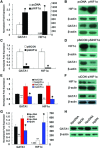
Fig 2
Regulation of GATA1 gene expression by HIF1. (A) Real-time PCR analysis of HIF1A and GATA1 mRNA levels in K562 cells transfected with the HIF1α expression plasmid (pHIF1α) or empty plasmid (pcDNA) and subsequently incubated under hypoxia for 24 hrs. (B) Western blotting assay of HIF1α and GATA1 protein levels in K562 cells transfected with the HIF1α expression plasmid or corresponding empty vector and subsequently incubated under hypoxia for 48 hrs. (C) Real-time PCR analysis of HIF1A and GATA1 mRNA levels in K562 cells that were transfected with the HIF1α interference vector (pSiHIF1α) or psilencer control (pSiCON) and subsequently incubated under hypoxia for 24 hrs. (D) Western blotting assay of HIF1α and GATA1 protein levels in K562 cells transfected with the HIF1α interference plasmid or the corresponding empty vector and subsequently incubated under hypoxia for 48 hrs. (E) Real-time PCR analysis of HIF1A and GATA1 mRNA levels in K562 cells transfected with siRNA targeting HIF1A (siHIF1α) or control siRNA (siCON). After 24 hrs of transfection, the transfection medium was replaced with complete medium and the cells were cultured under normoxia (the left two columns) or hypoxia (the right two columns) for an additional 24 hrs. (F) Western blotting assay of HIF1α and GATA1 protein levels in K562 cells transfected with siRNA targeting HIF1A or control siRNA. After 24 hrs of transfection, the transfection medium was replaced with complete medium and the cells were cultured under hypoxia for an additional 24 hrs. The numbers in brackets indicate the mean fluorescent intensities. (G) Real-time PCR analysis of HIF1A and GATA1 mRNA levels in K562 cells transfected with the plasmid. pcDNA or pDN. After 6 hrs of transfection, the transfection medium was replaced with complete medium and the cells were cultured under normoxia (the left two columns) or hypoxia (the right two columns) for 36 hrs. pDN that consists of amino acids 28 through 390 of human HIF1α, contains the basic domain deletion that affects DNA binding, and the carboxyl-terminal truncation that affects transactivation. (H) Western blotting assay of GATA1 protein in K562 cells transfected with the plasmid. pcDNA or pDN. After 6 hrs of transfection, the transfection medium was replaced with complete medium and the cells were cultured under normoxia or hypoxia for 36 hrs. *P < 0.01.
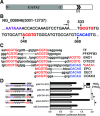
Fig 3
Identification of the functional HRE in the human GATA1 gene. (A) The location of the putative HRE in human GATA1 gene. (B) Nucleotide sequences matching the consensus HRE core motif are present in the 3′-flanking region within 1 kbp DNA fragment of the human GATA1 gene. The nucleotide sequences are numbered in relation to the transcription termination site. The putative HRE motif sequences are shown in red. The additional motif CACAG, which was identified in some HIF1 target genes but its function is not clear yet, is shown in blue. (C) Similarity of the putative HRE to the verified HRE in target genes of HIF1. (D) Identification of the functional HRE. K562 cells were co-transfected with a construct carrying the wild-type or motif-mutant of the 3′GATA1 sequence, and pRL-TK that provided an internal control. After transfection, the cells were cultured at 21% or 1% O2 for 24 hrs. The mean relative luciferase activity ratio is shown (±S.E.M., _n_= 3) relative to the activity in cells incubated at 21% O2. *P < 0.01.
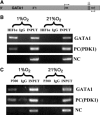
Fig 4
ChIP-PCR analysis of HIF1's binding to the DNA region containing the putative HREs. (A) The region of PCR amplification. The two vertical arrows indicate the positions of the HRE core motifs in the 3′-flanking region of the GATA1 gene. The two horizontal arrows indicate the locations of the two PCR primers. (B) PCR amplification of DNA fragments immunoprecipitated by anti-HIF1α. K562 cells were cultured under normoxia or hypoxia conditions for 24 hrs and subjected to ChIP assay as described in section Materials and methods. Rabbit polyclonal antibody to HIF1-α or IgG was used to precipitate sonicated chromatin. Sonicated cell lysate was used as an input control. NC: negative control; PC: positive control; PDK1: pyruvate dehydrogenase kinase 1 gene, which has been verified as a target gene of HIF1. (C) PCR amplification of immunoprecipitated DNA fragments by anti-p300 antibody.
Fig 5
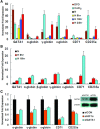
Real-time PCR analysis of the expressions of α-, β-, γ-, ɛ-globin, CD71 and CD235a mRNAs. (A) K562 cells were cultured under normoxic or hypoxic conditions or treated with 100 μM DFO or CoCl2 before harvest. (B) CD34+ erythroid cultures were maintained under normoxic or hypoxic conditions before harvest. (C) K562 cells were transfected with siRNA targeting HIF1A (siHIF1α) or GATA1 (siGATA1) or control siRNA (siCON). After 24 hrs of transfection, the transfection medium was replaced with complete medium and the cells were cultured under hypoxia for an additional 24 hrs. *P < 0.01. N: normoxia; H: hypoxia.
Fig 6
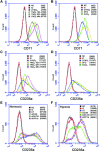
Flow cytometry analysis of the expression of CD71 and CD235a. (A) Induced expression of CD71 in K562 cells cultured under hypoxic conditions. (B) Induced expression of CD71 in K562 cells treated with 100 μM DFO or CoCl2. (C) Induced expression of CD235a in K562 cells cultured under hypoxic conditions. (D) Induced expression of CD235a in K562 cells treated with 100 μM DFO or CoCl2. (E) Expression of CD235a in K562 cells transfected with siRNA for 24 hrs and cultured under normoxic conditions for 36 hrs. (F) Expression of CD235a in K562 cells transfected with siRNA for 24 hrs and cultured under hypoxic conditions for 36 hrs. The numbers in brackets indicate the mean fluorescent intensities. NC: negative control, K562 cells without labelling; IC: isotype control, K562 cells labelled by isotype control IgG.
Fig 7
Flow cytometry analysis of CD235a-positive cells. (A) The K562 cells were untreated and unlabelled as a negative control. (B) The K562 cells were untreated but labelled with IgG isotype control. (C) The K562 cells transfected with siRNA control for 24 hrs and cultured under hypoxic conditions for another 24 hrs, and then labelled with PE-anti-CD235a. (D) The K562 cells transfected with siRNA targeting HIF1A for 24 hrs and cultured under hypoxic conditions for another 24 hrs, and then labelled with PE-anti-CD235a. M1 mark indicates the CD235a-positive peak. MFI, mean fluorescent intensity.
Similar articles
- Hypoxic induction of human erythroid-specific δ-aminolevulinate synthase mediated by hypoxia-inducible factor 1.
Zhang FL, Shen GM, Liu XL, Wang F, Zhao HL, Yu J, Zhang JW. Zhang FL, et al. Biochemistry. 2011 Feb 22;50(7):1194-202. doi: 10.1021/bi101585c. Epub 2011 Jan 20. Biochemistry. 2011. PMID: 21207956 - Effects of miR‑210‑3p on the erythroid differentiation of K562 cells under hypoxia.
Hu C, Yan Y, Fu C, Ding J, Li T, Wang S, Fang L. Hu C, et al. Mol Med Rep. 2021 Aug;24(2):563. doi: 10.3892/mmr.2021.12202. Epub 2021 Jun 10. Mol Med Rep. 2021. PMID: 34109429 Free PMC article. - Meis1, Hi1α, and GATA1 are integrated into a hierarchical regulatory network to mediate primitive erythropoiesis.
Chung HY, Lin BA, Lin YX, Chang CW, Tzou WS, Pei TW, Hu CH. Chung HY, et al. FASEB J. 2021 Oct;35(10):e21915. doi: 10.1096/fj.202001044RRR. FASEB J. 2021. PMID: 34496088 - A regulatory network governing Gata1 and Gata2 gene transcription orchestrates erythroid lineage differentiation.
Moriguchi T, Yamamoto M. Moriguchi T, et al. Int J Hematol. 2014 Nov;100(5):417-24. doi: 10.1007/s12185-014-1568-0. Epub 2014 Mar 18. Int J Hematol. 2014. PMID: 24638828 Review. - Regulation of GATA1 levels in erythropoiesis.
Gutiérrez L, Caballero N, Fernández-Calleja L, Karkoulia E, Strouboulis J. Gutiérrez L, et al. IUBMB Life. 2020 Jan;72(1):89-105. doi: 10.1002/iub.2192. Epub 2019 Nov 25. IUBMB Life. 2020. PMID: 31769197 Review.
Cited by
- MicroRNA-363 and GATA-1 are regulated by HIF-1α in K562 cells under hypoxia.
Xie Y, Li W, Feng J, Wu T, Li J. Xie Y, et al. Mol Med Rep. 2016 Sep;14(3):2503-10. doi: 10.3892/mmr.2016.5578. Epub 2016 Jul 29. Mol Med Rep. 2016. PMID: 27485543 Free PMC article. - 1,25(OH)2 D3 blocks IFNβ production through regulating STING in epithelial layer of oral lichen planus.
Ge X, Wang Y, Xie H, Li R, Zhang F, Zhao B, Du J. Ge X, et al. J Cell Mol Med. 2022 Jul;26(13):3751-3759. doi: 10.1111/jcmm.17409. Epub 2022 May 29. J Cell Mol Med. 2022. PMID: 35644988 Free PMC article. - Extracellular vesicle-derived miR-144 as a novel mechanism for chronic intermittent hypoxia-induced endothelial dysfunction.
Zhang H, Peng L, Wang Y, Zhao W, Lau WB, Wang Y, Li Y, Du Y, Li L, Huang Y, Nie S, Qin Y, Ma X, Wei Y. Zhang H, et al. Theranostics. 2022 May 16;12(9):4237-4249. doi: 10.7150/thno.69035. eCollection 2022. Theranostics. 2022. PMID: 35673562 Free PMC article. - Exploring the Leukemogenic Potential of GATA-1S, the Shorter Isoform of GATA-1: Novel Insights into Mechanisms Hampering Respiratory Chain Complex II Activity and Limiting Oxidative Phosphorylation Efficiency.
Trombetti S, Sessa R, Catapano R, Rinaldi L, Lo Bianco A, Feliciello A, Izzo P, Grosso M. Trombetti S, et al. Antioxidants (Basel). 2021 Oct 12;10(10):1603. doi: 10.3390/antiox10101603. Antioxidants (Basel). 2021. PMID: 34679737 Free PMC article. - Steroid resistance in Diamond Blackfan anemia associates with p57Kip2 dysregulation in erythroid progenitors.
Ashley RJ, Yan H, Wang N, Hale J, Dulmovits BM, Papoin J, Olive ME, Udeshi ND, Carr SA, Vlachos A, Lipton JM, Da Costa L, Hillyer C, Kinet S, Taylor N, Mohandas N, Narla A, Blanc L. Ashley RJ, et al. J Clin Invest. 2020 Apr 1;130(4):2097-2110. doi: 10.1172/JCI132284. J Clin Invest. 2020. PMID: 31961825 Free PMC article.
References
- Schofield CJ, Ratcliffe PJ. Oxygen sensing by HIF hydroxylases. Nat Rev Mol Cell Bio. 2004;5:343–54. - PubMed
- Semenza GL. Regulation of oxygen homeostasis by hypoxia-inducible factor 1. Physiology. 2009;24:97–106. - PubMed
- Tsiftsoglou AS, Vizirianakis IS, Strouboulis J. Erythropoiesis: model systems, molecular regulators, and developmental programs. IUBMB Life. 2009;61:800–30. - PubMed
Publication types
MeSH terms
Substances
LinkOut - more resources
Full Text Sources
