Detecting genome-wide epistases based on the clustering of relatively frequent items - PubMed (original) (raw)
Detecting genome-wide epistases based on the clustering of relatively frequent items
Minzhu Xie et al. Bioinformatics. 2012.
Abstract
Motivation: In genome-wide association studies (GWAS), up to millions of single nucleotide polymorphisms (SNPs) are genotyped for thousands of individuals. However, conventional single locus-based approaches are usually unable to detect gene-gene interactions underlying complex diseases. Due to the huge search space for complicated high order interactions, many existing multi-locus approaches are slow and may suffer from low detection power for GWAS.
Results: In this article, we develop a simple, fast and effective algorithm to detect genome-wide multi-locus epistatic interactions based on the clustering of relatively frequent items. Extensive experiments on simulated data show that our algorithm is fast and more powerful in general than some recently proposed methods. On a real genome-wide case-control dataset for age-related macular degeneration (AMD), the algorithm has identified genotype combinations that are significantly enriched in the cases.
Availability: http://www.cs.ucr.edu/\~minzhux/EDCF.zip
Contact: minzhux@cs.ucr.edu; jingli@cwru.edu
Supplementary information: Supplementary data are available at Bioinformatics online.
Figures
Fig. 1.
False positive rates under the null model. The plot in (a) shows the false positive rates of EDCF using different α0s for different _d_s, and the plots in (b) and (c) show the false positive rates of EDCF and BOOST when the sample size (b) and the number of SNPs (c) vary.
Fig. 2.
Performance comparison of EDCF and MB-MDR on four disease models for different allele frequencies. The sample size is 800 individuals including 400 cases and 400 controls and the LD level r_2=1. The black, red and green bars show the power of EDCF when α_s is set to be 0.01, 0.05 and 0.3, respectively. The blue bars show the power of MB-MDR.
Fig. 3.
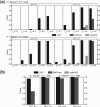
Performance comparison of EDCF, BOOST, SNPRuler, epiMODE and ChiSQ on four disease models for different allele frequencies, sample sizes and LD levels. The black, red, green, blue and cyan bars show the powers of EDCF, BOOST, SNPRuler, epiMODE and ChiSQ. respectively. The absence of a bar indicates no power. (a) Model 1; (b) Model 2; (c) Model 3; (d) Model 4.
Fig. 4.
Performance comparison on two 3-loci epistasis models. (a) Model 5 with some marginal effects. (b) Model 6 without marginal effects. The black, red and green bars show the powers of EDCF, SNPRuler and epiMODE respectively. The absence of a bar indicates no power.
Similar articles
- Cloud computing for detecting high-order genome-wide epistatic interaction via dynamic clustering.
Guo X, Meng Y, Yu N, Pan Y. Guo X, et al. BMC Bioinformatics. 2014 Apr 10;15:102. doi: 10.1186/1471-2105-15-102. BMC Bioinformatics. 2014. PMID: 24717145 Free PMC article. - Fast detection of high-order epistatic interactions in genome-wide association studies using information theoretic measure.
Leem S, Jeong HH, Lee J, Wee K, Sohn KA. Leem S, et al. Comput Biol Chem. 2014 Jun;50:19-28. doi: 10.1016/j.compbiolchem.2014.01.005. Epub 2014 Jan 27. Comput Biol Chem. 2014. PMID: 24581733 - A Markov blanket-based method for detecting causal SNPs in GWAS.
Han B, Park M, Chen XW. Han B, et al. BMC Bioinformatics. 2010 Apr 29;11 Suppl 3(Suppl 3):S5. doi: 10.1186/1471-2105-11-S3-S5. BMC Bioinformatics. 2010. PMID: 20438652 Free PMC article. - Detecting epistatic effects in association studies at a genomic level based on an ensemble approach.
Li J, Horstman B, Chen Y. Li J, et al. Bioinformatics. 2011 Jul 1;27(13):i222-9. doi: 10.1093/bioinformatics/btr227. Bioinformatics. 2011. PMID: 21685074 Free PMC article. - Detecting gene-gene interactions that underlie human diseases.
Cordell HJ. Cordell HJ. Nat Rev Genet. 2009 Jun;10(6):392-404. doi: 10.1038/nrg2579. Nat Rev Genet. 2009. PMID: 19434077 Free PMC article. Review.
Cited by
- Detecting PCOS susceptibility loci from genome-wide association studies via iterative trend correlation based feature screening.
Dai X, Fu G, Reese R. Dai X, et al. BMC Bioinformatics. 2020 May 4;21(1):177. doi: 10.1186/s12859-020-3492-z. BMC Bioinformatics. 2020. PMID: 32366216 Free PMC article. - HiSeeker: Detecting High-Order SNP Interactions Based on Pairwise SNP Combinations.
Liu J, Yu G, Jiang Y, Wang J. Liu J, et al. Genes (Basel). 2017 May 31;8(6):153. doi: 10.3390/genes8060153. Genes (Basel). 2017. PMID: 28561745 Free PMC article. - CINOEDV: a co-information based method for detecting and visualizing n-order epistatic interactions.
Shang J, Sun Y, Liu JX, Xia J, Zhang J, Zheng CH. Shang J, et al. BMC Bioinformatics. 2016 May 17;17(1):214. doi: 10.1186/s12859-016-1076-8. BMC Bioinformatics. 2016. PMID: 27184783 Free PMC article. - A Secure High-Order Gene Interaction Detecting Method for Infectious Diseases.
Wang H, Yin H, Wu X. Wang H, et al. Comput Math Methods Med. 2022 Apr 21;2022:4471736. doi: 10.1155/2022/4471736. eCollection 2022. Comput Math Methods Med. 2022. PMID: 35495886 Free PMC article. - A parallelized strategy for epistasis analysis based on Empirical Bayesian Elastic Net models.
Wen J, Ford CT, Janies D, Shi X. Wen J, et al. Bioinformatics. 2020 Jun 1;36(12):3803-3810. doi: 10.1093/bioinformatics/btaa216. Bioinformatics. 2020. PMID: 32227194 Free PMC article.
References
- Cordell H.J. Epistasis: what it means, what it doesn't mean, and statistical methods to detect it in humans. Hum. Mol. Genet. 2002;11:2463–2468. - PubMed


