Evidence against cellular internalization in vivo of NMO-IgG, aquaporin-4, and excitatory amino acid transporter 2 in neuromyelitis optica - PubMed (original) (raw)
Evidence against cellular internalization in vivo of NMO-IgG, aquaporin-4, and excitatory amino acid transporter 2 in neuromyelitis optica
Julien Ratelade et al. J Biol Chem. 2011.
Abstract
Autoantibodies against astrocyte water channel aquaporin-4 (AQP4) are thought to be pathogenic in neuromyelitis optica (NMO). Prior work has suggested that a key component of NMO autoantibody (NMO-IgG) pathogenesis is internalization of AQP4 and the associated glutamate transporter EAAT2, leading to glutamate excitotoxicity. Here, we show selective endocytosis of NMO-IgG and AQP4 in transfected cell cultures, but little internalization in brain in vivo. AQP4-dependent endocytosis of NMO-IgG occurred rapidly in various AQP4-transfected cell lines, with efficient transport from early endosomes to lysosomes. Cell surface AQP4 was also reduced following NMO-IgG exposure. However, little or no internalization of NMO-IgG, AQP4, or EAAT2 was found in primary astrocyte cultures, nor was glutamate uptake affected by NMO-IgG exposure. Following injection of NMO-IgG into mouse brain, NMO-IgG binding and AQP4 expression showed a perivascular astrocyte distribution, without detectable cellular internalization over 24 h. We conclude that astrocyte endocytosis of NMO-IgG, AQP4, and EAAT2 is not a significant consequence of AQP4 autoantibody in vivo, challenging generally accepted views about NMO pathogenesis.
Figures
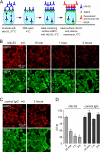
FIGURE 1.
Rapid endocytosis of rAb-53 in CHO cells stably transfected with AQP4. A, schematic of internalization assay. CHO cells stably expressing AQP4 (M23 isoform) were labeled with rAb-53-Cy3 at 4 °C, washed, and chased at 37 °C for specified times. Fluorescence of rAb-53-Cy3 remaining at the cell surface was quenched with the dark quencher bromocresol green. B, rAb-53-Cy3 fluorescence before and after addition of quencher at the indicated chase times. Micrographs are representative of four separate sets of experiments. C, colocalization (arrowheads) of rAb-53-Cy3 (red) with the early endosome marker EEA1 (green) at 15-min chase and with a lysosomal marker (green) at 3-h chase.
FIGURE 2.
Reduced cell surface AQP4 in AQP4-transfected CHO cells following rAb-53 exposure. A, schematic of assay. CHO cells stably expressing AQP4 (M23 isoform) were incubated for specified times with rAb-53 at 37 °C, washed, cooled to 4 °C, and assayed for cell surface AQP4 by addition of rAb-53 and fluorescent secondary antibody. Plasma membrane was stained green with fluorescent WGA. B, cells stained for surface AQP4 (red) and plasma membrane (WGA, green) following incubation with rAb-53 for the indicated times. C, experiments as in B except that cells were incubated with a control (non-NMO) IgG. D, quantification of surface AQP4 from ratio of (background-subtracted) red-to-green fluorescence (R/G, mean ± S.E. (error bars), n = 10; *, p < 0.01). Results are representative of two sets of experiments.
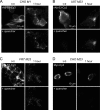
FIGURE 3.
Specificity of rAb-53 internalization in AQP4-transfected cell cultures. A–C, Cy3 fluorescence before and after addition of quencher, showing internalization of rAb-53-Cy3 at 1-h chase in CHO cells expressing AQP4-M1 (A), U87 cells expressing AQP4-M23 (B), and FRT cells expressing AQP4-M23 (C). D, same internalization assay (1-h chase) in CHO cells expressing AQP4-M23 containing a Myc epitope inserted in its second extracellular loop and with a Cy3-labeled anti-Myc antibody. Results are representative of three sets of experiments.
FIGURE 4.
AQP4, rAb-53, and EAAT2 cellular processing in primary astrocyte cultures. A, rAb-53-Cy3 (red) binding to AQP4 (green) on mouse primary astrocyte cultures. Data are shown for astrocytes from wild type (+/+) and AQP4 null (−/−) mice. B, Cy3 fluorescence (left and middle) before and after addition of quencher, showing minimal internalization of rAb-53-Cy3 at 1-h chase. Right, as positive controls for endocytosis, cells incubated for 1 h with Texas Red hydrazide or fluorescein-transferrin. C, left, cells stained for surface AQP4 (red) and plasma membrane (WGA, green) at indicated times after incubation with rAb-53 (done as in Fig. 2). Right, quantification of surface AQP4 (mean ± S.E. (error bars), n = 10). D, top, confocal microscopy showing EAAT2 (red) and GFAP (green) staining of astrocytes before and after incubation with rAb-53. Bottom, EAAT2 immunoblot of mouse brain and spinal cord, and astrocyte cultures. E, glutamate uptake in astrocytes preincubated for 24 h with rAb-53 or control IgG (mean ± S.E., n = 3). Results are representative of two separate sets of experiments.
FIGURE 5.
rAb-53 binding to AQP4 in vivo following intracerebral injection in mouse brain. A, spatial distribution of rAb-53-Cy3 (red) in brain at 3 h after injection. AQP4 stained green. White line, needle track; yellow dashed line, area of rAb-53-Cy3 diffusion; white square, area where micrographs in B and C were obtained. B, confocal fluorescence microscopy showing perivascular colocalization of rAb-53-Cy3 (red) with AQP4 (green) at 3 h after injection in wild-type mice (+/+). Controls included injection of (non-NMO) IgG in wild-type mice and rAb-53-Cy3 in AQP4-null mice (−/−). C, localization of rAb-53-Cy3 (red) at 20 min and 1, 3, and 24 h after injection, showing perivascular localization with AQP4 (green). Micrographs are representative of studies done on 3–4 mice at each time point.
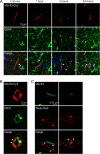
FIGURE 6.
Perivascular astrocyte surface localization of rAb-53 in vivo following intracerebral injection. A, confocal microscopy showing rAb-53-Cy3 (red) in brain stained for GFAP (green) and nuclei (blue) at 20 min and 1, 3, and 24 h after injection. Arrowheads in merge image indicate astrocytes stained for GFAP whose processes extend to the perivascular space. B, confocal microscopy showing rAb-53-Cy3 (red) and the endothelial marker CD31 (green) at 3 h after injection. Arrowheads indicate rAb-53-Cy3 surrounding CD31. C, confocal microscopy at 3 h after injection of Texas Red hydrazide (a dye internalized by astrocytes, red) and rAb-53 (stained with a secondary anti-human antibody, green). Arrowheads indicate astrocyte foot processes extending to the perivascular space.
FIGURE 7.
Perivascular astrocyte membrane localization of AQP4 in vivo following intracerebral injection of purified IgG from NMO sera. A, left, mouse astrocytes stained for surface AQP4 (red) and plasma membrane (WGA, green) after a 24-h incubation with purified IgG from NMO or control sera (done as in Fig. 2). Right, quantification of surface AQP4 (mean ± S.E. (error bars), n = 10). B, EAAT2 (red) and GFAP (green) staining of astrocytes after 24-h incubation with control or NMO-IgG. C, intracerebral injection. Brain section stained for human IgG (green, showing area of diffusion) and AQP4 (red). White line, needle tract; white square, area where AQP4 localization was assessed in D. D, confocal micrographs of AQP4 (red) and GFAP (green) at 20 min and 24 h after injection of control or NMO-IgG. Arrowheads indicate GFAP-stained astrocyte foot processes. Results are representative of micrographs from 2–4 mice per condition.
Similar articles
- Aquaporin-4-binding autoantibodies in patients with neuromyelitis optica impair glutamate transport by down-regulating EAAT2.
Hinson SR, Roemer SF, Lucchinetti CF, Fryer JP, Kryzer TJ, Chamberlain JL, Howe CL, Pittock SJ, Lennon VA. Hinson SR, et al. J Exp Med. 2008 Oct 27;205(11):2473-81. doi: 10.1084/jem.20081241. Epub 2008 Oct 6. J Exp Med. 2008. PMID: 18838545 Free PMC article. - Neuromyelitis optica IgG does not alter aquaporin-4 water permeability, plasma membrane M1/M23 isoform content, or supramolecular assembly.
Rossi A, Ratelade J, Papadopoulos MC, Bennett JL, Verkman AS. Rossi A, et al. Glia. 2012 Dec;60(12):2027-39. doi: 10.1002/glia.22417. Epub 2012 Sep 14. Glia. 2012. PMID: 22987455 Free PMC article. - Autoantibody-induced internalization of CNS AQP4 water channel and EAAT2 glutamate transporter requires astrocytic Fc receptor.
Hinson SR, Clift IC, Luo N, Kryzer TJ, Lennon VA. Hinson SR, et al. Proc Natl Acad Sci U S A. 2017 May 23;114(21):5491-5496. doi: 10.1073/pnas.1701960114. Epub 2017 May 1. Proc Natl Acad Sci U S A. 2017. PMID: 28461494 Free PMC article. - Effector functions of antiaquaporin-4 autoantibodies in neuromyelitis optica.
Cayrol R, Saikali P, Vincent T. Cayrol R, et al. Ann N Y Acad Sci. 2009 Sep;1173:478-86. doi: 10.1111/j.1749-6632.2009.04871.x. Ann N Y Acad Sci. 2009. PMID: 19758189 Review. - Neuromyelitis optica: aquaporin-4 based pathogenesis mechanisms and new therapies.
Ratelade J, Verkman AS. Ratelade J, et al. Int J Biochem Cell Biol. 2012 Sep;44(9):1519-30. doi: 10.1016/j.biocel.2012.06.013. Epub 2012 Jun 17. Int J Biochem Cell Biol. 2012. PMID: 22713791 Free PMC article. Review.
Cited by
- Super-resolution imaging of aquaporin-4 orthogonal arrays of particles in cell membranes.
Rossi A, Moritz TJ, Ratelade J, Verkman AS. Rossi A, et al. J Cell Sci. 2012 Sep 15;125(Pt 18):4405-12. doi: 10.1242/jcs.109603. Epub 2012 Jun 20. J Cell Sci. 2012. PMID: 22718347 Free PMC article. - Role of complement and potential of complement inhibitors in myasthenia gravis and neuromyelitis optica spectrum disorders: a brief review.
Chamberlain JL, Huda S, Whittam DH, Matiello M, Morgan BP, Jacob A. Chamberlain JL, et al. J Neurol. 2021 May;268(5):1643-1664. doi: 10.1007/s00415-019-09498-4. Epub 2019 Sep 3. J Neurol. 2021. PMID: 31482201 Review. - Molecular pathogenesis of neuromyelitis optica.
Bukhari W, Barnett MH, Prain K, Broadley SA. Bukhari W, et al. Int J Mol Sci. 2012 Oct 11;13(10):12970-93. doi: 10.3390/ijms131012970. Int J Mol Sci. 2012. PMID: 23202933 Free PMC article. Review. - The intrinsic pathogenic role of autoantibodies to aquaporin 4 mediating spinal cord disease in a rat passive-transfer model.
Geis C, Ritter C, Ruschil C, Weishaupt A, Grünewald B, Stoll G, Holmoy T, Misu T, Fujihara K, Hemmer B, Stadelmann C, Bennett JL, Sommer C, Toyka KV. Geis C, et al. Exp Neurol. 2015 Mar;265:8-21. doi: 10.1016/j.expneurol.2014.12.015. Epub 2014 Dec 24. Exp Neurol. 2015. PMID: 25542977 Free PMC article. - Aquaporin 4 and neuromyelitis optica.
Papadopoulos MC, Verkman AS. Papadopoulos MC, et al. Lancet Neurol. 2012 Jun;11(6):535-44. doi: 10.1016/S1474-4422(12)70133-3. Epub 2012 May 16. Lancet Neurol. 2012. PMID: 22608667 Free PMC article. Review.
References
- Jarius S., Wildemann B. (2010) Nat. Rev. Neurol. 6, 383–392 - PubMed
- Wingerchuk D. M., Lennon V. A., Lucchinetti C. F., Pittock S. J., Weinshenker B. G. (2007) Lancet Neurol. 6, 805–815 - PubMed
- Lennon V. A., Wingerchuk D. M., Kryzer T. J., Pittock S. J., Lucchinetti C. F., Fujihara K., Nakashima I., Weinshenker B. G. (2004) Lancet 364, 2106–2112 - PubMed
- Hinson S. R., McKeon A., Lennon V. A. (2010) Neuroscience 168, 1009–1018 - PubMed
Publication types
MeSH terms
Substances
Grants and funding
- HL73856/HL/NHLBI NIH HHS/United States
- R01 EY013574/EY/NEI NIH HHS/United States
- DK86125/DK/NIDDK NIH HHS/United States
- R01 EB000415/EB/NIBIB NIH HHS/United States
- R01 DK035124/DK/NIDDK NIH HHS/United States
- DK72517/DK/NIDDK NIH HHS/United States
- EY13574/EY/NEI NIH HHS/United States
- DK35124/DK/NIDDK NIH HHS/United States
- R01 HL073856/HL/NHLBI NIH HHS/United States
- P30 DK072517/DK/NIDDK NIH HHS/United States
- RC1 DK086125/DK/NIDDK NIH HHS/United States
- EB00415/EB/NIBIB NIH HHS/United States
- R37 DK035124/DK/NIDDK NIH HHS/United States
- R37 EB000415/EB/NIBIB NIH HHS/United States
LinkOut - more resources
Full Text Sources
Other Literature Sources
Molecular Biology Databases


