The fractalkine receptor but not CCR2 is present on microglia from embryonic development throughout adulthood - PubMed (original) (raw)
The fractalkine receptor but not CCR2 is present on microglia from embryonic development throughout adulthood
Makiko Mizutani et al. J Immunol. 2012.
Abstract
Microglial cells are difficult to track during development because of the lack of specific reagents for myeloid subpopulations. To further understand how myeloid lineages differentiate during development to create microglial cells, we investigated CX3CR1 and CCR2 transcription unit activation in Cx3cr1(+/GFP)CCR2(+/RFP) knockin fluorescent protein reporter mice. The principal findings include: 1) CX3CR1(+) cells localized to the aorta-gonad-mesonephros region, and visualized at embryonic day (E)9.0 in the yolk sac and neuroectoderm; 2) at E10.5, CX3CR1 single-positive microglial cells were visualized penetrating the neuroepithelium; and 3) CX3CR1 and CCR2 distinguished infiltrating macrophages from resident surveillant or activated microglia within tissue sections and by flow cytometric analyses. Our results support the contribution of the yolk sac as a source of microglial precursors. We provide a novel model to monitor chemokine receptor expression changes in microglia and myeloid cells early (E8.0-E10.5) in development and during inflammatory conditions, which have been challenging to visualize in mammalian tissues.
Figures
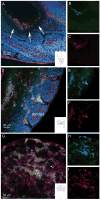
FIGURE 1. Ccr2+/RFP/Cx3cr1+/GFP positive cells are visualized at E8.5 stage of development
Whole embryos were incubated with with IB4 –Cy5 to visualize the vasculature (magenta) and tissues (A-F) were counterstained with DAPI (blue). Merged image from an unturned embryo (A) at the level of gut region (A, arrows and inset) shows clusters of CX3CR1+ (B, green) and CCR2+ (C, red) double positive cells. Images from a turned embryo at the level of the somites (D-F) and telencephalic vesicle (G-I) show abundant numbers of CX3CR1+ (E and H, green) and CCR2+ cells (F and I, red) present throughout the tissues. Notably, a population consisting of CX3CR1hi single positive cells were detected in the developing brain which appear IB4+ (G-I, asterisks). Insets in panels A, D and G, show a schematic of the embryo with a small square highlighting the source of the image.
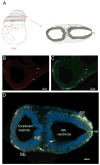
FIGURE 2. Ccr2+/RFP/Cx3cr1+/GFP cells are localized in the neuroectoderm and visualized in developing E9.5 tissues
(A) Shows the plane of section in schematic form. An E9.5 tissue shows that both receptors are expressed by myeloid precursors localized between the developing neuroepithelium and surface ectoderm. Tissues were stained with DAPI to visualize the nuclei (blue). (B) Distribution of CCR2-RFP+ cells, and (C) CX3CR1-GFP+ cells. (D) Merged image shows a dense band of myeloid precursors that appear mostly double positive. CX3CR1 single positive microglial precursor cells were clearly detected in the surface ectoderm (arrows).
FIGURE 3. Developing microglial cells appear as CX3CR1bright and CCR2−
(A) Low power of the whole embryo is shown in the inset to locate the origin of the image (red square). E11.5 tissues show that CX3CR1 but not CCR2 is expressed by developing microglial cells (A, merged image). Free-floating sagital -30 um sections in thickness- were obtained and incubated with IB4 (blue) to visualize the vasculature. Confocal image of the neopallial cortex shows CX3CR1+ (A and B, green) and CCR2+ (A and C, red) expressing cells. Developing amoeboid microglia appear CX3CR1bright (asterisks) and CCR2- (asterisks), while circulating mononuclear phagocytes exhibit a CX3CR1loCCR2bright phenotype and appear within blood vessels (BV, arrows).
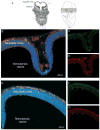
FIGURE 4. Distribution of cells in Ccr2+/RFP/Cx3cr1+/GFP E11.5 tissues
(A) Shows the plane of section in schematic form. (B-G) Confocal images of free-floating 30um cross-sections of E11.5 tissues counterstained with DAPI (B and E, merged imaged, DAPI;blue) show CX3CR1+/CCR2+ double positive cells in the surface ectoderm (C and F, CX3CR1-GFP;green) and (D and G, CCR-RFP; red). Developing amoeboid microglia appear CX3CR1bright and localized in deep layers of neuroepithelium (arrows).
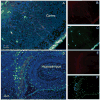
FIGURE 5. CX3CR1 is confined to microglial cells during development and expression is sustained throughout adulthood
Confocal images were obtained from brain tissues at P0 and counterstained with DAPI (blue). Cortical (A-C) and hippocampal (D-F) images shows that parenchymal cells are mostly CX3CR1bright (A and C, D and F; green) and fewer CCR2+ cells (A and B, and D and E; red) remain localized in the meningeal region.
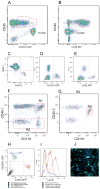
FIGURE 6. Analyses of monocyte subsets in brain lesions of EAE CX3CR1+/GFP CCR2+/RFP mice at peak disease
Flow cytometry analysis of mononuclear cells isolated from adult brain at peak EAE disease shows that the CD45lo population contains CX3CR1bright microglial cells (A), contrasting their lack of CCR2-RFP expression (B). Degree of bone marrow recosntitution was evaluated by staining PBMCs with CD45.1 and CD45.2 antibodies (C). CX3CR1-GFP (D) and CCR2-RFP (E) positive controls were obtained from Cx3cr1GFP/+/CCR2+/+ or Cx3cr1+/+/CCR2RFP/+ mice respectively. Brain leukocytes were analyzed for CD45.1 and CD11b expression (F) and peripherally derived myeloid cell (R1) were distinguished from resident CD45.2+ CD11b+ cells via expression of the congenic markers (G, R3). Analyses of CX3CR1 and CCR2 based on activation of the transcription unit and expression of the GFP and RFP reporters (H) shows that resident microglial cells appear as CX3CR1-single positive. (I) activated resident cells up regulated MHC-II expression upon EAE induction as compared with naïve brains, and confocal imaging from diseased mouse brains shows morphologically activated microglia as CX3CR1-GFP bright cells (J). Results show one representative set of data from one mouse out of 8 analyzed by flow cytometry and histology.
Similar articles
- Expression pattern of Ccr2 and Cx3cr1 in inherited retinal degeneration.
Kohno H, Koso H, Okano K, Sundermeier TR, Saito S, Watanabe S, Tsuneoka H, Sakai T. Kohno H, et al. J Neuroinflammation. 2015 Oct 12;12:188. doi: 10.1186/s12974-015-0408-3. J Neuroinflammation. 2015. PMID: 26458944 Free PMC article. - Cellular and Molecular Identity of Tumor-Associated Macrophages in Glioblastoma.
Chen Z, Feng X, Herting CJ, Garcia VA, Nie K, Pong WW, Rasmussen R, Dwivedi B, Seby S, Wolf SA, Gutmann DH, Hambardzumyan D. Chen Z, et al. Cancer Res. 2017 May 1;77(9):2266-2278. doi: 10.1158/0008-5472.CAN-16-2310. Epub 2017 Feb 24. Cancer Res. 2017. PMID: 28235764 Free PMC article. - Chemokine receptors CCR2 and CX3CR1 regulate viral encephalitis-induced hippocampal damage but not seizures.
Käufer C, Chhatbar C, Bröer S, Waltl I, Ghita L, Gerhauser I, Kalinke U, Löscher W. Käufer C, et al. Proc Natl Acad Sci U S A. 2018 Sep 18;115(38):E8929-E8938. doi: 10.1073/pnas.1806754115. Epub 2018 Sep 4. Proc Natl Acad Sci U S A. 2018. PMID: 30181265 Free PMC article. - Cellular players that shape evolving pathology and neurodegeneration following traumatic brain injury.
Puntambekar SS, Saber M, Lamb BT, Kokiko-Cochran ON. Puntambekar SS, et al. Brain Behav Immun. 2018 Jul;71:9-17. doi: 10.1016/j.bbi.2018.03.033. Epub 2018 Mar 27. Brain Behav Immun. 2018. PMID: 29601944 Review. - Tickets to the brain: role of CCR2 and CX3CR1 in myeloid cell entry in the CNS.
Prinz M, Priller J. Prinz M, et al. J Neuroimmunol. 2010 Jul 27;224(1-2):80-4. doi: 10.1016/j.jneuroim.2010.05.015. Epub 2010 May 31. J Neuroimmunol. 2010. PMID: 20554025 Review.
Cited by
- Social defeat induces depressive-like states and microglial activation without involvement of peripheral macrophages.
Lehmann ML, Cooper HA, Maric D, Herkenham M. Lehmann ML, et al. J Neuroinflammation. 2016 Aug 31;13(1):224. doi: 10.1186/s12974-016-0672-x. J Neuroinflammation. 2016. PMID: 27581371 Free PMC article. - Fluorescent knock-in mice to decipher the physiopathological role of G protein-coupled receptors.
Ceredig RA, Massotte D. Ceredig RA, et al. Front Pharmacol. 2015 Jan 6;5:289. doi: 10.3389/fphar.2014.00289. eCollection 2014. Front Pharmacol. 2015. PMID: 25610398 Free PMC article. Review. - Neuroimmunological processes in Parkinson's disease and their relation to α-synuclein: microglia as the referee between neuronal processes and peripheral immunity.
Sanchez-Guajardo V, Barnum CJ, Tansey MG, Romero-Ramos M. Sanchez-Guajardo V, et al. ASN Neuro. 2013 Apr 30;5(2):113-39. doi: 10.1042/AN20120066. ASN Neuro. 2013. PMID: 23506036 Free PMC article. Review. - Coculture system with an organotypic brain slice and 3D spheroid of carcinoma cells.
Chuang HN, Lohaus R, Hanisch UK, Binder C, Dehghani F, Pukrop T. Chuang HN, et al. J Vis Exp. 2013 Oct 9;(80):50881. doi: 10.3791/50881. J Vis Exp. 2013. PMID: 24145580 Free PMC article. - The kinetics of myelin antigen uptake by myeloid cells in the central nervous system during experimental autoimmune encephalomyelitis.
Sosa RA, Murphey C, Ji N, Cardona AE, Forsthuber TG. Sosa RA, et al. J Immunol. 2013 Dec 15;191(12):5848-57. doi: 10.4049/jimmunol.1300771. Epub 2013 Nov 13. J Immunol. 2013. PMID: 24227784 Free PMC article.
References
- del Rio-Hortega P. Microglia. In: Penfield W, editor. Cytology and cellular pathology of the nervous system. Hoeber; New York: 1932. pp. 481–584.
- Carson MJ, Reilly CR, Sutcliffe JG, Lo D. Mature microglia resemble immature antigen-presenting cells. Glia. 1998;22:72–85. - PubMed
- Ford AL, Goodsall AL, Hickey WF, Sedgwick JD. Normal adult ramified microglia separated from other central nervous system macrophages by flow cytometric sorting. Phenotypic differences defined and direct ex vivo antigen presentation to myelin basic protein-reactive CD4+ T cells compared. J Immunol. 1995;154:4309–4321. - PubMed
- Ponomarev ED, Shriver LP, Maresz K, Dittel BN. Microglial cell activation and proliferation precedes the onset of CNS autoimmunity. J Neurosci Res. 2005;81:374–389. - PubMed
- Bazan JF, Bacon KB, Hardiman G, Wang W, Soo K, Rossi D, Greaves DR, Zlotnik A, Schall TJ. A new class of membrane-bound chemokine with a CX3C motif. Nature. 1997;385:640–644. - PubMed
Publication types
MeSH terms
Substances
LinkOut - more resources
Full Text Sources
Other Literature Sources
Molecular Biology Databases
Research Materials
