Phenotypic and genotypic analysis of in vitro-selected artemisinin-resistant progeny of Plasmodium falciparum - PubMed (original) (raw)
Phenotypic and genotypic analysis of in vitro-selected artemisinin-resistant progeny of Plasmodium falciparum
Matthew S Tucker et al. Antimicrob Agents Chemother. 2012 Jan.
Abstract
Emergence of artemisinin resistance in Cambodia highlights the importance of characterizing resistance to this class of drugs. Previously, intermediate levels of resistance in Plasmodium falciparum were generated in vitro for artelinic acid (AL) and artemisinin (QHS). Here we expanded on earlier selection efforts to produce levels of clinically relevant concentrations, and the resulting lines were characterized genotypically and phenotypically. Recrudescence assays determined the ability of resistant and parent lines to recover following exposure to clinically relevant levels of drugs. Interestingly, the parent clone (D6) tolerated up to 1,500 ng/ml QHS, but the resistant parasite, D6.QHS340×3, recovered following exposure to 2,400 ng/ml QHS. Resistant D6, W2, and TM91c235 parasites all exhibited elevated 50% inhibitory concentrations (IC(50)s) to multiple artemisinin drugs, with >3-fold resistance to QHS and AL; however, the degree of resistance obtained with standard methods was remarkably less than expected for parasite lines that recovered from 2,400-ng/ml drug pressure. A novel assay format with radiolabeled hypoxanthine demonstrated a greater degree of resistance in vitro than the standard SYBR green method. Analysis of merozoite number in resistant parasites found D6 and TM91c235 resistant progeny had significantly fewer merozoites than parent strains, whereas W2 resistant progeny had significantly more. Amplification of pfmdr1 increased proportionately to the increased drug levels tolerated by W2 and TM91c235, but not in resistant D6. In summary, we define the artemisinin resistance phenotype as a decrease in susceptibility to artemisinins along with the ability to recover from drug-induced dormancy following supraclinical concentrations of the drug.
Figures
Fig 1
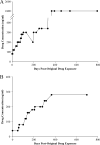
Adaptation of D6 and TM91c235 to increasing amounts of artemisinin drugs. Lines D6 and TM91c235 were previously adapted to 80 ng/ml AL and QHS (12) and used to initiate higher levels of resistance. (A) D6 resistant to 80 ng/ml of QHS (D6.QHS80) was discontinuously treated with increments of 20 to 40 ng/ml QHS to increase drug tolerance. Individual points in the graph correspond to a single treatment at a particular drug concentration level. During the procedure, D6.QHS300×2 was treated with 200 ng/ml QHS prior to a cloning attempt. Induction of resistance was later continued with 300 ng/ml QHS. (B) TM91c235 adapted to 80 ng/ml of AL (TM91c235.AL80) was treated discontinuously with increments of 20 to 40 ng/ml AL in order to increase drug tolerance.
Fig 2
Comparison of dormant and dead parasites after a typical exposure to artemisinin drugs. (A) After ring-stage parasites were treated with artemisinin drugs, they became dormant, developed a rounded morphology, and retained blue cytoplasm and red chromatin on a Giemsa smear. (B) Dead parasites lacked distinct chromatin and cytoplasm, appearing globular, and they appeared red/purple on a Giemsa smear.
Fig 3
Comparison of recrudescence in W2 parent and resistant lines after dihydroartemisinin treatment. (A) Parent W2 and resistant line W2.QHS200×2 were exposed to 200 ng/ml DHA for 6 h, and the parasitemia level was determined approximately every 24 h after drug exposure (up to 165.5 h post-drug exposure). (B) The dormant/total parasite ratio was calculated at each time point post-drug exposure. (C) The normal/total parasite ratio was calculated at each time point. Corresponding photomicrographs of parasites during the time course (through 120 h post-drug exposure) are shown below the graph.
Fig 4
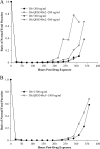
Comparison of recrudescence in D6 parent and resistant lines after artemisinin treatment. (A) Normal/total parasite ratio for D6 and D6.QHS340×2 after 48 h of exposure to 28.2 to 340 ng/ml QHS (data shown are for 200 ng/ml and 300 ng/ml). Cultures were monitored up to 336 h post-drug exposure. (B) The normal/total parasite ratio for D6 and D6.QHS340×3 after 48 h of exposure to 80 to 2,400 QHS (shown is a representative example, at 1,500 ng/ml). Cultures were monitored up to 360 h post-drug exposure.
Fig 5
Growth and merozoite numbers in parent and resistant progeny of D6, W2, and TM91c235 lines. (A) The mean merozoite numbers in segmenting schizonts of D6 and resistant D6.QHS2400×5, W2 and resistant W2.QHS200×2, and TM91c235 and resistant TM91c235.AL280×2 are shown. The number of merozoites was lower in D6.QHS2400×5 (*, P < 0.001) and TM91c235.AL280×2 (***, P = 0.007) than in the respective parent strains. The number of merozoites per schizont was greater in resistant W2 parasites than in the parental W2 parasites (**, P < 0.001). (B) Photomicrographs of typical segmenting schizonts of D6, W2, and TM91c235 parental and resistant parasites. Examples of a segmenting schizont containing the mean, minimum, and maximum (left to right) numbers of merozoites for each strain are shown.
Fig 6
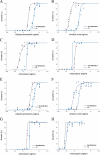
Drug susceptibility assay utilizing hypoxanthine incorporation and parent and resistant progeny of D6 and W2 lines. D6 and W2 lines were treated with QHS, DHA, AL, and CQ, and tritiated hypoxanthine was immediately added. The percent parasite growth at 48 h was plotted as a function of drug concentration (in ng/ml). The graphs show results for D6 plus DHA (A), D6 plus AL (B), D6 plus QHS (C), D6 plus CQ (D), W2 plus DHA (E), W2 plus AL (F), W2 plus QHS (G), and W2 plus CQ (H).
Fig 7
pfmdr1 copy numbers in parent and resistant progeny of D6, W2, and TM91c235 lines. Mean copy numbers of pfmdr1 and pfmdr2 in parental and resistant strains (D6, W2, and TM91c235) relative to D6, as determined by SYBR green real-time QPCR, are shown. Copy number assays were run ≥2 times for each parasite line tested.
Similar articles
- Role of pfmdr1 amplification and expression in induction of resistance to artemisinin derivatives in Plasmodium falciparum.
Chavchich M, Gerena L, Peters J, Chen N, Cheng Q, Kyle DE. Chavchich M, et al. Antimicrob Agents Chemother. 2010 Jun;54(6):2455-64. doi: 10.1128/AAC.00947-09. Epub 2010 Mar 29. Antimicrob Agents Chemother. 2010. PMID: 20350946 Free PMC article. - In vitro selection of Plasmodium falciparum Pfcrt and Pfmdr1 variants by artemisinin.
Njokah MJ, Kang'ethe JN, Kinyua J, Kariuki D, Kimani FT. Njokah MJ, et al. Malar J. 2016 Jul 22;15(1):381. doi: 10.1186/s12936-016-1443-y. Malar J. 2016. PMID: 27449110 Free PMC article. - Phenotypic changes in artemisinin-resistant Plasmodium falciparum lines in vitro: evidence for decreased sensitivity to dormancy and growth inhibition.
Teuscher F, Chen N, Kyle DE, Gatton ML, Cheng Q. Teuscher F, et al. Antimicrob Agents Chemother. 2012 Jan;56(1):428-31. doi: 10.1128/AAC.05456-11. Epub 2011 Oct 10. Antimicrob Agents Chemother. 2012. PMID: 21986828 Free PMC article. - pfmdr1 (Plasmodium falciparum multidrug drug resistance gene 1): a pivotal factor in malaria resistance to artemisinin combination therapies.
Gil JP, Krishna S. Gil JP, et al. Expert Rev Anti Infect Ther. 2017 Jun;15(6):527-543. doi: 10.1080/14787210.2017.1313703. Epub 2017 Apr 10. Expert Rev Anti Infect Ther. 2017. PMID: 28355493 Review. - How genomics is contributing to the fight against artemisinin-resistant malaria parasites.
Cravo P, Napolitano H, Culleton R. Cravo P, et al. Acta Trop. 2015 Aug;148:1-7. doi: 10.1016/j.actatropica.2015.04.007. Epub 2015 Apr 21. Acta Trop. 2015. PMID: 25910626 Review.
Cited by
- The Plasmodium PI(4)K inhibitor KDU691 selectively inhibits dihydroartemisinin-pretreated Plasmodium falciparum ring-stage parasites.
Dembele L, Ang X, Chavchich M, Bonamy GMC, Selva JJ, Lim MY, Bodenreider C, Yeung BKS, Nosten F, Russell BM, Edstein MD, Straimer J, Fidock DA, Diagana TT, Bifani P. Dembele L, et al. Sci Rep. 2017 May 24;7(1):2325. doi: 10.1038/s41598-017-02440-6. Sci Rep. 2017. PMID: 28539634 Free PMC article. - Trypanosoma cruzi amastigotes that persist in the colon during chronic stage murine infections have a reduced replication rate.
Ward AI, Olmo F, Atherton RL, Taylor MC, Kelly JM. Ward AI, et al. Open Biol. 2020 Dec;10(12):200261. doi: 10.1098/rsob.200261. Epub 2020 Dec 16. Open Biol. 2020. PMID: 33321060 Free PMC article. - Trio fluorophore-based phenotypic assay for the detection of artemisinin-induced growth-arrested Plasmodium falciparum in human erythrocytes.
Kobpornchai P, Imwong M, Kulkeaw K. Kobpornchai P, et al. Sci Rep. 2024 Jan 20;14(1):1802. doi: 10.1038/s41598-024-52414-8. Sci Rep. 2024. PMID: 38245618 Free PMC article. - Upregulation of gametocytogenesis in anti-malarial drug-resistant Plasmodium falciparum.
Rajapandi T. Rajapandi T. J Parasit Dis. 2019 Sep;43(3):458-463. doi: 10.1007/s12639-019-01110-w. Epub 2019 Apr 3. J Parasit Dis. 2019. PMID: 31406411 Free PMC article. - A novel flow cytometric hemozoin detection assay for real-time sensitivity testing of Plasmodium falciparum.
Rebelo M, Sousa C, Shapiro HM, Mota MM, Grobusch MP, Hänscheid T. Rebelo M, et al. PLoS One. 2013 Apr 24;8(4):e61606. doi: 10.1371/journal.pone.0061606. Print 2013. PLoS One. 2013. PMID: 23637865 Free PMC article.
References
- Alker AP, et al. 2007. pfmdr1 and in vivo resistance to artesunate-mefloquine in falciparum malaria on the Cambodian-Thai border. Am. J. Trop. Med. Hyg. 76:641–647 - PubMed
Publication types
MeSH terms
Substances
LinkOut - more resources
Full Text Sources


