Synaptic properties of corticocortical connections between the primary and secondary visual cortical areas in the mouse - PubMed (original) (raw)
Synaptic properties of corticocortical connections between the primary and secondary visual cortical areas in the mouse
Roberto De Pasquale et al. J Neurosci. 2011.
Abstract
Despite the importance of corticocortical connections, few published studies have investigated the functional, synaptic properties of such connections in any species, because most studies have been purely anatomical or aimed at functional features other than synaptic properties. We recently published a study of synaptic properties of connections between the primary and secondary cortical auditory areas in brain slices from the mouse, and, in the present study, we aimed to extend this by performing analogous studies of the primary and secondary visual areas (V1 and V2). We found effectively the same results. That is, connections between V1 and V2 in both directions were quite similar; in each case, the glutamatergic inputs could be classified as one of two types, Class 1B (formerly "driver") and Class 2 (formerly "modulator"). There is a clear laminar correlation for these different inputs, in terms of both the laminae of origin and those in which the recorded cells were located. Our data suggest a common pattern to the functional organization of corticocortical connectivity in the mouse cortex.
Figures
Figure 1.
Identification of visual cortical areas in the mouse. A, Differential interference contrast image of living slice preparation during a recording session. In V1, layer 4 and layer 5b have higher cell packing densities compared with V2. Layer 1 is thin and aneuronal. We did not distinguish layer 2 from layer 3 and refer to these as “layers 2/3”; these lie directly above the dense packing of cells in layer 4. Layer 5a is more sparsely packed with cells than is layer 4. Layer 5b shows an increase in cell packing density, and layer 6 has a lower cell packing density than layer 5b. B, Example of a brain section immunostained with an antibody to the type 2/3 mGluR. C, Example of a brain section stained for cytochrome oxidase. D, Example of brain section immunostained with an antibody to parvalbumin.
Figure 2.
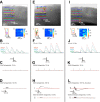
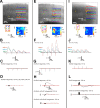
Response examples in the V1-to-V2 pathway. A–D, Example of a Class 1B response with recorded cell in layer 4 of V2 and afferent footprint in layer 4 of V1. A, Responses evoked by photostimulation. The recording site in V1 is indicated by the yellow star. The footprint and hotspot region is enlarged in Ai and shown in false color in Aii. B, Stimulation in the hotspot elicits paired-pulse depression and a graded response. C, The response is blocked by iGluR antagonists at a stimulation rate of 15 Hz. D, HFS with iGluR antagonists fails to evoke metabotropic activation. E–H, Example of a Class 2 response; conventions as in A–D. The recorded cell is in layers 2/3 of V2 and afferent footprint in layers 2/3 of V1. Stimulation of the hotspot elicits paired-pulse facilitation and a graded response (F). The response is blocked by iGluR antagonists at a 15 Hz stimulation rate (G), and HFS with iGluR antagonists evokes a depolarizing response (Hi), which is blocked by an mGluR1 antagonist (Hii). I–L, Example of a Class 2 response with cell in layer 5a of V2 and afferent footprint in layer 6 of V1. Conventions as in E–H. Here the metabotropic response is hyperpolarizing (Li) and blocked by mGluR2/3 antagonist (Lii).
Figure 3.
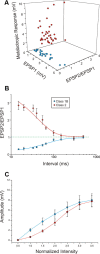
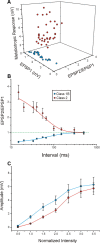
Properties of Class1B and Class 2 responses in the V1-to-V2 pathway. A, Three-dimensional graph showing the relationships among the amplitude of the first EPSP (EPSP1), the paired-pulse ratio, or amplitude of the second EPSP divided by the first (EPSP2/EPSP1), and the maximum amplitude of the mGluR response. B, Graph showing how depression in Class 1B responses and facilitation in Class 2 responses (mean ± SE) increase with the decrease of the interval between the two stimuli. A first-order exponential decay is fitted to each function. C, The average first EPSP amplitude is plotted against the stimulation intensity normalized to threshold value, meaning that the abscissa is divided into units that are multiples of the threshold current for each cell.
Figure 4.
Laminar relationships of Class1B and Class 2 responses in the V1-to-V2 pathway. A, Laminar normalized distribution of the hotspots in V1 eliciting responses in V2. B, Laminar normalized distribution of cells in V2 receiving inputs from V1. C, Matrix showing laminar relationships of Class 1B responses. Each cell of the matrix shows the percentage of hotspots of the indicated layer of V1 that provides input to the indicated layer of V2. D, Laminar relationships of Class 2 responses; conventions as in C.
Figure 5.
Activation of mGluR types in Class 2 responses in the V1-to-V2 pathway. A, Percentage of cells receiving Class 2 inputs with patterns of mGluR activation as shown. B, Laminar distribution of response types by layer recorded in V2. C, Activation rate of each mGluR type among cells in V2. The rate is calculated as the percentage of activation of each mGluR type regardless of the concomitant activation of other mGluR types.
Figure 6.
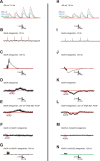
Postsynaptic activation of mGluRs in the V1-to-V2 pathway. A–G, Example showing a typical Class 2 response including the activation of mGluR1s for cell recorded in layer 4 of V2 with hotspot in layer 4 of V1. The response is graded and shows paired-pulse facilitation (A), is blocked by iGluR antagonists at a stimulation rate of 15 Hz (B), and shows a depolarizing mGluR response after HFS with iGluR antagonists (C). With normal ACSF and iGluR antagonists, application of ACPD also evokes a consistent depolarization (D) that persists after the switch to a high Mg2+/low Ca2+ ACSF (E). After the subsequent addition of an mGluR1 antagonist, both ACPD (F) and HFS after normal Ca2+ and Mg2+ were restored (G) fail to evoke mGluRs. H–N, Example showing the activation of mGluR2/3s; conventions as in A–G, with the differences that the cell is recorded in layer 5a of V2 with hotspot in layer 5b of V1 and that mGluR2/3s are evoked, leading to hyperpolarization.
Figure 7.
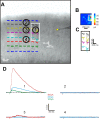
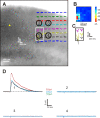
Control experiment in the V1-to-V2 pathway. A, Example of a control experiment showing a recorded cell in layer 4 of V2 (yellow star) and different attempts of stimulation with bipolar concentric electrode in V1 inside (1) and just outside (2–4) the footprint in layer 4. The footprint region shown in A is shown in false color in B and enlarged in C. D, Stimulation elicits a clear EPSP with low intensity of stimulation only when applied in the location 1 within the footprint. Stimulation at locations 2 and 4 next to the footprint evoked no detectable response, and that at location 3 evoked a small response not resembling a monosynaptic EPSP and does so only with high (300 μA) stimulation intensity.
Figure 8.
Response examples in the V2-to-V1 pathway. Conventions as in Figure 2. A–D, Example of a Class 1B response with cell in layer 5b of V1 and footprint in layer 5b of V2. E–H, Example of a Class 2 response with cell in layer 5a of V2 and footprint in layer 5a of V1, and in this case both mGluR1s and mGluR5s were evoked. I–L, Example of a Class 2 response recorded in cell in layer 4 of V2 and elicited by a footprint found in layer 4 of V1, and in this case mGluR2/3s were evoked. We cannot account for the initial depolarization in L.
Figure 9.
Properties of Class1B and Class 2 responses in the V2-to-V1 pathway. Conventions as in Figure 3.
Figure 10.
Laminar relationships of Class1B and Class 2 responses in the V2-to-V1 pathway. Conventions as in Figure 4.
Figure 11.
Postsynaptic activation of mGluRs in the V2-to-V1 pathway. Conventions as in Figure 5.
Figure 12.
Control experiment in the V2-to-V1 pathway. Example of a control experiment showing a recorded cell in layer 4 of V1 (yellow star) and different attempts of stimulation with bipolar concentric electrode in V2 inside (1) and outside (2–4) the footprint in layer 5a. A–D, Conventions as in Figure 7. As shown in D, only stimulation in the footprint evoked EPSPs in the recorded cell.
Figure 13.
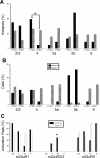
Comparison between V1-to-V2 and V2-to-V1 pathways. A, Laminar normalized distribution of the footprints showing class of efferent for the two pathways. Only the footprints originating in layer 4 show a significant difference (*p < 0.05, Fisher's exact test). B, Laminar normalized distribution of recorded cells showing class of input. The distribution is not significantly different for the two pathways. C, Laminar distribution of recorded cells with Class 2 inputs showing types of mGluR evoked. The only difference found in the two pathways is in layer 5a, in which mGluR2/3 activation was found only for the V1-to-V2 pathway (*p < 0.05, a χ2 test).
Figure 14.
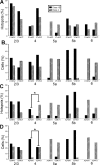
Comparison of laminar relationships between auditory and visual pathways. Data for the auditory pathways (A1-to-A2v and A2v-to-A1) for this figure and Figure 15 are taken from Covic and Sherman (2011). A, Comparison between A1-to-A2v and V1-to-V2 pathways for laminar normalized distribution of footprints. B, Comparison between A1-to-A2v and V1-to-V2 pathways for laminar normalized distribution of recorded cells. C, Comparison between A2v-to-A1 and V2-to-V1 pathways for the laminar distribution of footprints. D, Comparison between A2v-to-A1 and V2-to-V1 pathways for laminar location of recorded cells. *p < 0.05.
Figure 15.
Comparison for Class 2 mGluR activation between auditory and visual pathways. The relative percentage is plotted for each mGluR type, and the total exceeds 100% in many cases because many cells showed multiple types (e.g., Fig. 8_H_,L). A, Comparison for the primary to secondary direction. B, Comparison for the secondary to primary direction. *p < 0.01.
Similar articles
- Pull-push neuromodulation of LTP and LTD enables bidirectional experience-induced synaptic scaling in visual cortex.
Huang S, Treviño M, He K, Ardiles A, Pasquale Rd, Guo Y, Palacios A, Huganir R, Kirkwood A. Huang S, et al. Neuron. 2012 Feb 9;73(3):497-510. doi: 10.1016/j.neuron.2011.11.023. Neuron. 2012. PMID: 22325202 Free PMC article. - Cell type-specific, presynaptic LTP of inhibitory synapses on fast-spiking GABAergic neurons in the mouse visual cortex.
Sarihi A, Mirnajafi-Zadeh J, Jiang B, Sohya K, Safari MS, Arami MK, Yanagawa Y, Tsumoto T. Sarihi A, et al. J Neurosci. 2012 Sep 19;32(38):13189-99. doi: 10.1523/JNEUROSCI.1386-12.2012. J Neurosci. 2012. PMID: 22993435 Free PMC article. - Primary visual cortex shows laminar-specific and balanced circuit organization of excitatory and inhibitory synaptic connectivity.
Xu X, Olivas ND, Ikrar T, Peng T, Holmes TC, Nie Q, Shi Y. Xu X, et al. J Physiol. 2016 Apr 1;594(7):1891-910. doi: 10.1113/JP271891. Epub 2016 Mar 11. J Physiol. 2016. PMID: 26844927 Free PMC article. - Multivesicular release differentiates the reliability of synaptic transmission between the visual cortex and the somatosensory cortex.
Huang CH, Bao J, Sakaba T. Huang CH, et al. J Neurosci. 2010 Sep 8;30(36):11994-2004. doi: 10.1523/JNEUROSCI.2381-10.2010. J Neurosci. 2010. PMID: 20826663 Free PMC article. - Synaptic properties of the mammillary and cortical afferents to the anterodorsal thalamic nucleus in the mouse.
Petrof I, Sherman SM. Petrof I, et al. J Neurosci. 2009 Jun 17;29(24):7815-9. doi: 10.1523/JNEUROSCI.1564-09.2009. J Neurosci. 2009. PMID: 19535593 Free PMC article.
Cited by
- Modulatory effects of metabotropic glutamate receptors on local cortical circuits.
De Pasquale R, Sherman SM. De Pasquale R, et al. J Neurosci. 2012 May 23;32(21):7364-72. doi: 10.1523/JNEUROSCI.0090-12.2012. J Neurosci. 2012. PMID: 22623682 Free PMC article. - A modulatory effect of the feedback from higher visual areas to V1 in the mouse.
De Pasquale R, Sherman SM. De Pasquale R, et al. J Neurophysiol. 2013 May;109(10):2618-31. doi: 10.1152/jn.01083.2012. Epub 2013 Feb 27. J Neurophysiol. 2013. PMID: 23446698 Free PMC article. - Properties of the primary somatosensory cortex projection to the primary motor cortex in the mouse.
Petrof I, Viaene AN, Sherman SM. Petrof I, et al. J Neurophysiol. 2015 Apr 1;113(7):2400-7. doi: 10.1152/jn.00949.2014. Epub 2015 Jan 28. J Neurophysiol. 2015. PMID: 25632081 Free PMC article. - How attention can create synaptic tags for the learning of working memories in sequential tasks.
Rombouts JO, Bohte SM, Roelfsema PR. Rombouts JO, et al. PLoS Comput Biol. 2015 Mar 5;11(3):e1004060. doi: 10.1371/journal.pcbi.1004060. eCollection 2015 Mar. PLoS Comput Biol. 2015. PMID: 25742003 Free PMC article. - Distinct organization of two cortico-cortical feedback pathways.
Shen S, Jiang X, Scala F, Fu J, Fahey P, Kobak D, Tan Z, Zhou N, Reimer J, Sinz F, Tolias AS. Shen S, et al. Nat Commun. 2022 Oct 27;13(1):6389. doi: 10.1038/s41467-022-33883-9. Nat Commun. 2022. PMID: 36302912 Free PMC article.
References
- Atzori M, Lei S, Evans DI, Kanold PO, Phillips-Tansey E, McIntyre O, McBain CJ. Differential synaptic processing separates stationary from transient inputs to the auditory cortex. Nat Neurosci. 2001;4:1230–1237. - PubMed
- Beck PD, Kaas JH. Cortical connections of the dorsomedial visual area in prosimian primates. J Comp Neurol. 1998a;398:162–178. - PubMed
- Beck PD, Kaas JH. Cortical connections of the dorsomedial visual area in New World owl monkeys (Aotus trivirgatus) and squirrel monkeys (Saimiri sciureus) J Comp Neurol. 1998b;400:18–34. - PubMed
- Bourassa J, Deschênes M. Corticothalamic projections from the primary visual cortex in rats: a single fiber study using biocytin as an anterograde tracer. Neuroscience. 1995;66:253–263. - PubMed
- Bourassa J, Pinault D, Deschênes M. Corticothalamic projections from the cortical barrel field to the somatosensory thalamus in rats: a single-fibre study using biocytin as an anterograde tracer. Eur J Neurosci. 1995;7:19–30. - PubMed
Publication types
MeSH terms
Substances
LinkOut - more resources
Full Text Sources

