Guanine nucleotides differentially modulate backbone dynamics of the STAS domain of the SulP/SLC26 transport protein Rv1739c of Mycobacterium tuberculosis - PubMed (original) (raw)
Guanine nucleotides differentially modulate backbone dynamics of the STAS domain of the SulP/SLC26 transport protein Rv1739c of Mycobacterium tuberculosis
Alok K Sharma et al. FEBS J. 2012 Feb.
Abstract
Enzymatic catalysis and protein signaling are dynamic processes that involve local and/or global conformational changes occurring across a broad range of time scales. (1) H-(15) N relaxation NMR provides a comprehensive understanding of protein backbone dynamics both in the apo (unliganded) and ligand-bound conformations, enabling both fast and slow internal motions of individual amino acid residues to be observed. We recently reported the structure and nucleotide binding properties of the sulfate transporter and anti-sigma factor antagonist (STAS) domain of Rv1739c, a SulP anion transporter protein of Mycobacterium tuberculosis. In the present study, we report (1) H-(15) N NMR backbone dynamics measurements [longitudinal (T(1) ), transverse (T(2) ) and steady-state ({(1) H}-(15) N) heteronuclear NOE] of the Rv1739c STAS domain, in the absence and presence of saturating concentrations of GTP and GDP. Analysis of measured relaxation data and estimated dynamic parameters indicated distinct features differentiating the binding of GTP and GDP to Rv1739c STAS. The 9.55 ns overall rotational correlation time of Rv1739c STAS increased to 10.48 ns in the presence of GTP, and to 13.25 ns in the presence of GDP, indicating significant nucleotide-induced conformational changes. These conformational changes were accompanied by slow time scale (μs to ms) motions in discrete regions of the protein, as reflected by guanine nucleotide-induced changes in relaxation parameters. The observed nucleotide-specific alterations in the relaxation properties of individual STAS residues reflect an increased molecular anisotropy and/or the emergence of conformational equilibria governing functional properties of the STAS domain.
© 2011 The Authors Journal compilation © 2011 FEBS.
Figures
Fig. 1
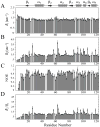
15N-relaxation data of Rv1739c STAS domain (~0.5 mM in 50 mM Na phosphate, pH 7.2, 275 mM NaCl) recorded at 600.13 MHz, 300 K. (A) longitudinal relaxation rates (R1), (B) transverse relaxation rates (_R_2), (C) steady-state heteronuclear NOEs, and (D) _R_2/_R_1 ratios are plotted as a function of Rv1739c STAS domain amino acid sequence. STAS secondary structure deduced from the NMR solution tertiary structure is shown at top.
Fig. 2
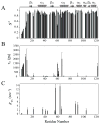
Model-free parameters of Rv1739c STAS as determined considering axially symmetric tumbling of the molecule. The values of (A) generalized order parameter (_S_2), (B) effective correlation time for internal motions (τe), and (C) exchange terms (_R_ex) with their error values were deduced by fitting the relaxation data to the five models of the model-free formalism, and plotted as a function of amino acid sequence. STAS secondary structure is shown at top.
Fig. 3
Model-free parameters mapped onto the ribbon representation of Rv1739c STAS. (A) Values of generalized order parameters (_S_2) are highlighted for each residue as follows: blue, _S_2 ≤ 0.7; magenta, 0.71 ≤ _S_2 > 0.8; yellow, 0.81 ≤ _S_2 > 0.9; red, 0.91 ≤ S2 > 1.0; gray, data unavailable (ND). (B) Values of effective correlation times (τe) for each residue: light magenta, residues experiencing faster motions (τe ≤ 100 ps); blue, residues experiencing slower motions (τe > 100 ps). (C) Residues with exchange terms (_R_ex) that account for conformational and/or chemical exchange are dark red. In (B) and (C), STAS ribbon structure is light gray (“hydrogen” in the PyMOL carbon pseudocolor scheme).
Fig. 4
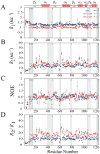
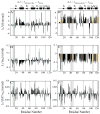
15N-relaxation data for unliganded Rv1739c STAS, (~0.5 mM in 50 mM Na phosphate, pH 7.2, 275 mM NaCl) and for Rv1739c STAS in the presence of 20 mM GTP and 20 mM GDP recorded at 600.13 MHz, 300 K. (A) Superposed sequence-specific longitudinal relaxation rates (_R_1). (B) Superposed sequence-specific transverse relaxation rates (_R_2). (C) Superposed sequence-specific {1H}-15N heteronuclear NOEs. (D) Superposed sequence-specific _R_2/_R_1 ratios. Shaded bars highlight residues experiencing chemical shift perturbation (CSP) upon nucleotide binding; bars marked by ‘*’ indicate residues perturbed by both GTP and GDP {}. CSP residues that exhibit increased _R_2 and J(0) and decreased NOE and J(ωN) values are aquamarine for GTP and yellow for GDP; see text for details. STAS secondary structure is shown at top.
Fig. 5
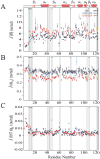
Reduced spectral density functions deduced from 15N relaxation data for free, GTP-bound, and GDP-bound STAS. (A) Superposed sequence-specific J(0) functions. (B) Superposed sequence-specific J(ωN) functions. (C) Superposed sequence-specific J(0.87ωH) functions. Shaded bars highlight residues experiencing chemical shift perturbation (CSP) upon nucleotide binding; bars marked by ‘*’ indicate residues perturbed by both GTP and GDP { }. CSP residues that exhibit increased _R_2 and J(0) and decreased NOE and J(ωN) values are aquamarine for GTP and yellow for GDP; see text for details. STAS secondary structure is shown at top.
Fig. 6
Sequence-specific reduced spectral density function value differences (Δ_J_) between nucleotide-bound and free STAS. Left panels, (A–C),Δ_J_ between GTP-bound STAS and free STAS; Right panels, (D-F), Δ_J_ between GDP-bound STAS and free STAS. (A & D) Δ_J_(0), (B & E) Δ_J_(ωN), and (C & F) Δ_J_ (0.87ωH). Shaded bars highlight residues experiencing chemical shift perturbation (CSP) upon nucleotide binding; bars marked by ‘*’ indicate residues perturbed by both GTP and GDP {}. CSP residues that exhibit increased _R_2 and J(0) and decreased NOE and J(ωN) values are aquamarine for GTP and yellow for GDP. STAS secondary structure is at top of each column of panels.
Fig. 7
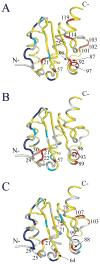
J(0) values mapped onto the Rv1739c STAS average structure. (A) J(0) values of STAS domain; (B) J(0) values of STAS+GTP; (C) J(0) values of STAS+GDP. On the light gray ribbon structure, blue residues have J(0) < 2/5τm and _J_(0.87ωH) > 7.5 ps/rad; cyan residues have J(0) < 2/5τm and _J_(0.87ωH) < 7.5 ps/rad; yellow residues have 2/5τm < _J_(0) > J(0)cutoff rendered; red residues have J(0) > J(0)cutoff rendered red and are labeled by residue number. J(0)cutoff = J(0) + one RMSD.
Similar articles
- Solution structure of the guanine nucleotide-binding STAS domain of SLC26-related SulP protein Rv1739c from Mycobacterium tuberculosis.
Sharma AK, Ye L, Baer CE, Shanmugasundaram K, Alber T, Alper SL, Rigby AC. Sharma AK, et al. J Biol Chem. 2011 Mar 11;286(10):8534-8544. doi: 10.1074/jbc.M110.165449. Epub 2010 Dec 29. J Biol Chem. 2011. PMID: 21190940 Free PMC article. - NMR assignment and secondary structure of the STAS domain of Rv1739c, a putative sulfate transporter of Mycobacterium tuberculosis.
Sharma AK, Ye L, Zolotarev AS, Alper SL, Rigby AC. Sharma AK, et al. Biomol NMR Assign. 2009 Jun;3(1):99-102. doi: 10.1007/s12104-009-9150-z. Epub 2009 Mar 14. Biomol NMR Assign. 2009. PMID: 19636956 - Molecular dynamics simulations of the STAS domains of rat prestin and human pendrin reveal conformational motions in conserved flexible regions.
Sharma AK, Zelikovic I, Alper SL. Sharma AK, et al. Cell Physiol Biochem. 2014;33(3):605-20. doi: 10.1159/000358638. Epub 2014 Feb 27. Cell Physiol Biochem. 2014. PMID: 24603188 - STAS domain structure and function.
Sharma AK, Rigby AC, Alper SL. Sharma AK, et al. Cell Physiol Biochem. 2011;28(3):407-22. doi: 10.1159/000335104. Epub 2011 Nov 16. Cell Physiol Biochem. 2011. PMID: 22116355 Free PMC article. Review. - STAS Domain Only Proteins in Bacterial Gene Regulation.
Moy BE, Seshu J. Moy BE, et al. Front Cell Infect Microbiol. 2021 Jun 21;11:679982. doi: 10.3389/fcimb.2021.679982. eCollection 2021. Front Cell Infect Microbiol. 2021. PMID: 34235094 Free PMC article. Review.
Cited by
- The SLC26 gene family of anion transporters and channels.
Alper SL, Sharma AK. Alper SL, et al. Mol Aspects Med. 2013 Apr-Jun;34(2-3):494-515. doi: 10.1016/j.mam.2012.07.009. Mol Aspects Med. 2013. PMID: 23506885 Free PMC article. Review. - Sulfate Transporters in Dissimilatory Sulfate Reducing Microorganisms: A Comparative Genomics Analysis.
Marietou A, Røy H, Jørgensen BB, Kjeldsen KU. Marietou A, et al. Front Microbiol. 2018 Mar 2;9:309. doi: 10.3389/fmicb.2018.00309. eCollection 2018. Front Microbiol. 2018. PMID: 29551997 Free PMC article. Review.
References
- Shelden MC, Howitt SM, Price GD. Membrane topology of the cyanobacterial bicarbonate transporter, BicA, a member of the SulP (SLC26A) family. Mol Membr Biol. 2010;27:12–23. - PubMed
- Dorwart MR, Shcheynikov N, Yang D, Muallem S. The solute carrier 26 family of proteins in epithelial ion transport. Physiology (Bethesda) 2008;23:104–114. - PubMed
- Mount DB, Romero MF. The SLC26 gene family of multifunctional anion exchangers. Pflugers Arch. 2004;447:710–721. - PubMed
- Barrett JC, Lee JC, Lees CW, Prescott NJ, Anderson CA, Phillips A, Wesley E, Parnell K, Zhang H, Drummond H, Nimmo ER, Massey D, Blaszczyk K, Elliott T, Cotterill L, Dallal H, Lobo AJ, Mowat C, Sanderson JD, Jewell DP, Newman WG, Edwards C, Ahmad T, Mansfield JC, Satsangi J, Parkes M, Mathew CG, Donnelly P, Peltonen L, Blackwell JM, Bramon E, Brown MA, Casas JP, Corvin A, Craddock N, Deloukas P, Duncanson A, Jankowski J, Markus HS, Mathew CG, McCarthy MI, Palmer CN, Plomin R, Rautanen A, Sawcer SJ, Samani N, Trembath RC, Viswanathan AC, Wood N, Spencer CC, Barrett JC, Bellenguez C, Davison D, Freeman C, Strange A, Donnelly P, Langford C, Hunt SE, Edkins S, Gwilliam R, Blackburn H, Bumpstead SJ, Dronov S, Gillman M, Gray E, Hammond N, Jayakumar A, McCann OT, Liddle J, Perez ML, Potter SC, Ravindrarajah R, Ricketts M, Waller M, Weston P, Widaa S, Whittaker P, Deloukas P, Peltonen L, Mathew CG, Blackwell JM, Brown MA, Corvin A, McCarthy MI, Spencer CC, Attwood AP, Stephens J, Sambrook J, Ouwehand WH, McArdle WL, Ring SM, Strachan DP. Genome-wide association study of ulcerative colitis identifies three new susceptibility loci, including the HNF4A region. Nat Genet. 2009;41:1330–1334. - PMC - PubMed
- Yusa A, Miyazaki K, Kimura N, Izawa M, Kannagi R. Epigenetic silencing of the sulfate transporter gene DTDST induces sialyl Lewisx expression and accelerates proliferation of colon cancer cells. Cancer Res. 2011;70:4064–4073. - PubMed
Publication types
MeSH terms
Substances
LinkOut - more resources
Full Text Sources
Miscellaneous
