The nuclear receptor PPARβ/δ programs muscle glucose metabolism in cooperation with AMPK and MEF2 - PubMed (original) (raw)
The nuclear receptor PPARβ/δ programs muscle glucose metabolism in cooperation with AMPK and MEF2
Zhenji Gan et al. Genes Dev. 2011.
Abstract
To identify new gene regulatory pathways controlling skeletal muscle energy metabolism, comparative studies were conducted on muscle-specific transgenic mouse lines expressing the nuclear receptors peroxisome proliferator-activated receptor α (PPARα; muscle creatine kinase [MCK]-PPARα) or PPARβ/δ (MCK-PPARβ/δ). MCK-PPARβ/δ mice are known to have enhanced exercise performance, whereas MCK-PPARα mice perform at low levels. Transcriptional profiling revealed that the lactate dehydrogenase b (Ldhb)/Ldha gene expression ratio is increased in MCK-PPARβ/δ muscle, an isoenzyme shift that diverts pyruvate into the mitochondrion for the final steps of glucose oxidation. PPARβ/δ gain- and loss-of-function studies in skeletal myotubes demonstrated that PPARβ/δ, but not PPARα, interacts with the exercise-inducible kinase AMP-activated protein kinase (AMPK) to synergistically activate Ldhb gene transcription by cooperating with myocyte enhancer factor 2A (MEF2A) in a PPARβ/δ ligand-independent manner. MCK-PPARβ/δ muscle was shown to have high glycogen stores, increased levels of GLUT4, and augmented capacity for mitochondrial pyruvate oxidation, suggesting a broad reprogramming of glucose utilization pathways. Lastly, exercise studies demonstrated that MCK-PPARβ/δ mice persistently oxidized glucose compared with nontransgenic controls, while exhibiting supranormal performance. These results identify a transcriptional regulatory mechanism that increases capacity for muscle glucose utilization in a pattern that resembles the effects of exercise training.
© 2011 by Cold Spring Harbor Laboratory Press
Figures
Figure 1.
MCK-PPARβ drives an LDHB/LDHA isoenzyme shift, reprogramming muscle for increased glucose oxidation. (A) Schematic depicts the lactate- and glucose-derived pyruvate catabolic fates. The reaction catalyzed by LDH isoenzymes is shown with the A isoenzyme (LDHA) favoring pyruvate to lactate and the B isoenzyme (LDHB) favoring the reverse reaction. (B) Results of qRT–PCR analysis of Ldha and Ldhb mRNA levels in soleus, gastrocnemius (Gastroc), and white vastus (WV) muscles from indicated mice (n ≥ 6 mice in each group). Values represent mean (±SEM) shown as arbitrary units (AU) normalized (=1.0) to the value of NTG control. (*) P < 0.05 compared with corresponding NTG control. (C) A representative LDH isoenzyme activity gel is shown. Isoenzymes were separated by polyacrylamide gel electrophoresis using whole-cell extracts from NTG heart (Ht, control) and gastrocnemius muscle from indicated mice (n ≥ 3 mice in each group). Note a distinct shift toward the LDHB-containing isoenzymes LDH4, LDH3, and LDH2, with a concomitant reduction in LDH5 (which lacks the B isoenzyme) in the MCK-PPARβ samples.
Figure 2.
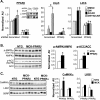
PPARβ activates and cooperates with AMPKα to activate Ldhb gene expression via a ligand-independent mechanism. (A) Results of qRT–PCR analysis for primary mouse myotubes after infection with adenovirus expressing specific or scrambled shRNAs as indicated. Forty-eight hours post-infection, myotubes were treated for 24 h with DMSO (vehicle), 0.5 μM GW501516 (GW), 1 mM AICAR, or GW + AICAR as indicated in the key. Values represent mean (±SEM) arbitrary units (AU) normalized (=1.0) to the value of DMSO-treated scrambled shRNA (n = 3). (*) P < 0.05 versus the corresponding scrambled shRNA; (‡) P < 0.05 versus DMSO control. (Inset) Western blot analysis confirms an increase in p-AMPKα levels in myotubes treated with AICAR for 30 min. (B, left) Results of Western blot analysis performed on extracts of gastrocnemius muscle isolated from NTG or MCK-PPARβ mice using p-AMPKα (Thr 172), AMPKα, p-ACC (Ser 79), or total ACC antibodies. (Right) Quantification of the p-AMPK/AMPK and p-ACC/ACC signal ratios (n = 8 mice in each group) normalized (=1.0) to the NTG control. (C, left) Results of Western blot analysis performed on gastrocnemius muscle extracts using CaMKKα, LKB1, and S6RP (control) antibodies. (Right) Quantification of the Western blot signals corrected to S6RP (n ≥ 3 mice in each group). Values represent mean (±SEM) shown as arbitrary units (AU) normalized (=1.0) to the value of NTG control. (*) P < 0.05 compared with NTG.
Figure 3.
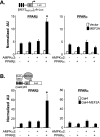
PPARβ and MEF2 bind to the Ldhb promoter. (A) The results of ChIP assays performed on primary mouse myotubes following infection with Ad-PPARβ. Schematic shows PCR primer set location (−1228 and −1078) and the putative MEF2-binding site relative to the Ldhb promoter transcription start site (= +1). (Left) Results of representative gel analysis showing relative binding (PCR results) to Ldhb, Cpt1b, and Ucp1 promoters and control (L32) promoter. Antibodies (or IgG control) are shown at the top. (Right) Graphs display mean SYBR Green-based quantification of ChIP normalized to IgG control (n = 3). (*) P < 0.05 versus IgG control. (B) Results of qRT–PCR analysis for primary mouse myotubes after transfection with Mef2a siRNAs or scrambled control siRNAs as indicated. Values represent mean (±SEM) shown as arbitrary units (AU) normalized (=1.0) to the value of control siRNAs (n = 4). (*) P < 0.05 versus control.
Figure 4.
AMPK–PPARβ–MEF2 interaction. (A,B) Co-IP experiments were performed by cotransfecting Myc-AMPKα2, PPARβ, PPARα, and/or Flag-MEF2A in HEK293 cells as indicated at the top. Antibodies against the Myc or Flag epitope were used for co-IP. The extracts (Input) from the HEK293 cells and the proteins from the immunoprecipitation were analyzed by immunoblotting (IB). Representative results for co-IP (repeated at least twice) are shown. (C) Co-IP results with extracts prepared from gastrocnemius muscle extracts prepared from indicated mice using anti-PPARβ or anti-PPARα antibodies (n = 4 per group). (D) AMPKα2 ChIP assays performed on primary mouse myotubes following infection with Ad-PPARβ. Myotubes were treated for 6 h with DMSO (vehicle), 0.5 μM GW501516 (GW), or 1 mM AICAR. Schematic shows PCR primer set location on the Ldhb promoter. The graph displays mean SYBR Green-based quantification of AMPK-ChIP/IgG-ChIP normalized to DMSO (=1.0) control (n = 3). (*) P < 0.05 compared with DMSO control.
Figure 5.
PPARβ and AMPK synergistically coactivate MEF2A. (A,B) Values represent mean (±SEM) firefly/renilla luciferase activity shown as arbitrary units (AU) normalized (=1.0) to vector control in HEK293 cells after cotransfection with expression vectors indicated and either the [MEF2_MEF2A_]3-_tk_-Luc or five-copy Gal4-Luc (pG5Luc) reporters. All values represent the results of a minimum of three separate experiments done in triplicate. (*) P < 0.05 compared with MEF2A or Gal4-MEF2A alone.
Figure 6.
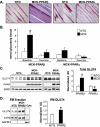
Increased glycogen stores in MCK-PPARβ muscle parallel-enhanced expression of GLUT4 protein. (A) Representative images of PAS staining of sections prepared from gastrocnemius muscles of 12- to 14-wk-old male MCK-PPARβ, MCK-PPARα, and NTG littermates at baseline (in the absence of exercise). (B) Bars represent mean glycogen levels (mmoles of glucose per gram of tissue) (±SEM) determined enzymatically (amyloglucosidase digestion) at baseline and after high-intensity run-to-exhaustion protocol (Exercise). (C, left) Results of Western blot analysis performed with gastrocnemius muscle total protein extracts prepared from indicated mice using GLUT4, PPARβ, PPARα, or S6RP (control) antibodies. (Right) Quantification of the blotting results (corrected to S6RP levels; n ≥ 5 mice in each group). Values represent mean (±SEM) shown as arbitrary units (AU) normalized (=1.0) to the value of NTG controls. (D, left) Results of Western blot analysis of the plasma membrane (PM) fraction of gastrocnemius muscle lysate from NTG or MCK-PPARβ mice using GLUT4, insulin receptor β subunit (InsRβ; membrane control), or GAPDH (cytosol control) antibodies. Cytosolic fraction (Cyto) is shown to confirm purity. Note that the lanes were run on the same gel but were noncontiguous. (Right) Quantification of the plasma membrane (PM) GLUT4 levels (corrected to InsRβ) (n ≥ 6 mice in each group). (*) P < 0.05 versus NTG.
Figure 7.
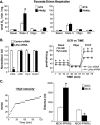
MCK-PPARβ mice exhibit enhanced high-intensity exercise performance. (A) Respiration rates determined from mitochondria isolated from hindlimb muscle of indicated genotypes using pyruvate as substrate. ADP-dependent respiration (state 3), oligomycin-induced state 4 (oligo) and the respiratory control ratio (RC) are shown. The increase in state 3 respiration in MCK-PPARβ mitochondria is consistent with an increased capacity for pyruvate oxidation. (*) P < 0.05 versus NTG. (B, left) Results of qRT−PCR analysis for primary mouse myotubes after transfection with Ldha siRNAs or scrambled control siRNAs as indicated. (Right) OCRs in primary mouse myotubes transfected with Ldha siRNAs or control siRNAs. Basal OCR was first measured, followed by administration of 2 μM oligomycin (Oligo, to inhibit ATP synthase) and then the uncoupler FCCP (2 μM). OCR were measured in the presence of 10 mM sodium pyruvate. Values represent mean (±SEM); n = 5 separate experiments done in five biological replicates. (*) P < 0.05 versus control. (C, right) Bars represent mean running distance (±SEM) for 12-wk-old male MCK-PPARβ and MCK-PPARα mice and littermate controls (NTG) during high-intensity (sprint) protocols (described in the Materials and Methods) on a motorized treadmill. (Left) Schematic depicts the speed change over time. n = 8−11 mice in each group. (*) P < 0.05 versus NTG.
Similar articles
- AMPK and PPARβ positive feedback loop regulates endurance exercise training-mediated GLUT4 expression in skeletal muscle.
Koh JH, Hancock CR, Han DH, Holloszy JO, Nair KS, Dasari S. Koh JH, et al. Am J Physiol Endocrinol Metab. 2019 May 1;316(5):E931-E939. doi: 10.1152/ajpendo.00460.2018. Epub 2019 Mar 19. Am J Physiol Endocrinol Metab. 2019. PMID: 30888859 Free PMC article. - Nuclear receptors PPARbeta/delta and PPARalpha direct distinct metabolic regulatory programs in the mouse heart.
Burkart EM, Sambandam N, Han X, Gross RW, Courtois M, Gierasch CM, Shoghi K, Welch MJ, Kelly DP. Burkart EM, et al. J Clin Invest. 2007 Dec;117(12):3930-9. doi: 10.1172/JCI32578. J Clin Invest. 2007. PMID: 18037994 Free PMC article. - Transcriptional profiling reveals divergent roles of PPARalpha and PPARbeta/delta in regulation of gene expression in mouse liver.
Sanderson LM, Boekschoten MV, Desvergne B, Müller M, Kersten S. Sanderson LM, et al. Physiol Genomics. 2010 Mar 3;41(1):42-52. doi: 10.1152/physiolgenomics.00127.2009. Epub 2009 Dec 15. Physiol Genomics. 2010. PMID: 20009009 - Peroxisome proliferator-activated receptor beta/delta as a therapeutic target for metabolic diseases.
Bedu E, Wahli W, Desvergne B. Bedu E, et al. Expert Opin Ther Targets. 2005 Aug;9(4):861-73. doi: 10.1517/14728222.9.4.861. Expert Opin Ther Targets. 2005. PMID: 16083348 Review. - Peroxisome proliferator-activated receptor beta/delta (PPARbeta/delta) acts as regulator of metabolism linked to multiple cellular functions.
Wagner KD, Wagner N. Wagner KD, et al. Pharmacol Ther. 2010 Mar;125(3):423-35. doi: 10.1016/j.pharmthera.2009.12.001. Epub 2009 Dec 22. Pharmacol Ther. 2010. PMID: 20026355 Review.
Cited by
- Impaired estrogen receptor action in the pathogenesis of the metabolic syndrome.
Hevener AL, Clegg DJ, Mauvais-Jarvis F. Hevener AL, et al. Mol Cell Endocrinol. 2015 Dec 15;418 Pt 3(Pt 3):306-21. doi: 10.1016/j.mce.2015.05.020. Epub 2015 May 29. Mol Cell Endocrinol. 2015. PMID: 26033249 Free PMC article. Review. - Disuse-associated loss of the protease LONP1 in muscle impairs mitochondrial function and causes reduced skeletal muscle mass and strength.
Xu Z, Fu T, Guo Q, Zhou D, Sun W, Zhou Z, Chen X, Zhang J, Liu L, Xiao L, Yin Y, Jia Y, Pang E, Chen Y, Pan X, Fang L, Zhu MS, Fei W, Lu B, Gan Z. Xu Z, et al. Nat Commun. 2022 Feb 16;13(1):894. doi: 10.1038/s41467-022-28557-5. Nat Commun. 2022. PMID: 35173176 Free PMC article. - Skeletal muscle mitochondrial remodeling in exercise and diseases.
Gan Z, Fu T, Kelly DP, Vega RB. Gan Z, et al. Cell Res. 2018 Oct;28(10):969-980. doi: 10.1038/s41422-018-0078-7. Epub 2018 Aug 14. Cell Res. 2018. PMID: 30108290 Free PMC article. Review. - Fasting Imparts a Switch to Alternative Daily Pathways in Liver and Muscle.
Kinouchi K, Magnan C, Ceglia N, Liu Y, Cervantes M, Pastore N, Huynh T, Ballabio A, Baldi P, Masri S, Sassone-Corsi P. Kinouchi K, et al. Cell Rep. 2018 Dec 18;25(12):3299-3314.e6. doi: 10.1016/j.celrep.2018.11.077. Cell Rep. 2018. PMID: 30566858 Free PMC article. - Skeletal Muscle Phospholipid Metabolism Regulates Insulin Sensitivity and Contractile Function.
Funai K, Lodhi IJ, Spears LD, Yin L, Song H, Klein S, Semenkovich CF. Funai K, et al. Diabetes. 2016 Feb;65(2):358-70. doi: 10.2337/db15-0659. Epub 2015 Oct 28. Diabetes. 2016. PMID: 26512026 Free PMC article.
References
- Brandt JM, Djouadi F, Kelly DP 1998. Fatty acids activate transcription of the muscle carnitine palmitoyltransferase I gene in cardiac myocytes via the peroxisome proliferator-activated receptor α. J Biol Chem 273: 23786–23792 - PubMed
- Burke LM, Hawley JA 1999. Carbohydrate and exercise. Curr Opin Clin Nutr Metab Care 2: 515–520 - PubMed
Publication types
MeSH terms
Substances
Grants and funding
- R37 AG000425/AG/NIA NIH HHS/United States
- P30 CA91842/CA/NCI NIH HHS/United States
- R01 DK045416/DK/NIDDK NIH HHS/United States
- P30 CA091842/CA/NCI NIH HHS/United States
- R01-DK045416/DK/NIDDK NIH HHS/United States
- P30 DK020579/DK/NIDDK NIH HHS/United States
LinkOut - more resources
Full Text Sources
Molecular Biology Databases
Miscellaneous


