Stem cell pathways contribute to clinical chemoresistance in ovarian cancer - PubMed (original) (raw)
Stem cell pathways contribute to clinical chemoresistance in ovarian cancer
Adam D Steg et al. Clin Cancer Res. 2012.
Abstract
Purpose: Within heterogeneous tumors, subpopulations often labeled cancer stem cells (CSC) have been identified that have enhanced tumorigenicity and chemoresistance in ex vivo models. However, whether these populations are more capable of surviving chemotherapy in de novo tumors is unknown.
Experimental design: We examined 45 matched primary/recurrent tumor pairs of high-grade ovarian adenocarcinomas for expression of CSC markers ALDH1A1, CD44, and CD133 using immunohistochemistry. Tumors collected immediately after completion of primary therapy were then laser capture microdissected and subjected to a quantitative PCR array examining stem cell biology pathways (Hedgehog, Notch, TGF-β, and Wnt). Select genes of interest were validated as important targets using siRNA-mediated downregulation.
Results: Primary samples were composed of low densities of ALDH1A1, CD44, and CD133. Tumors collected immediately after primary therapy were more densely composed of each marker, whereas samples collected at first recurrence, before initiating secondary therapy, were composed of similar percentages of each marker as their primary tumor. In tumors collected from recurrent platinum-resistant patients, only CD133 was significantly increased. Of stem cell pathway members examined, 14% were significantly overexpressed in recurrent compared with matched primary tumors. Knockdown of genes of interest, including endoglin/CD105 and the hedgehog mediators Gli1 and Gli2, led to decreased ovarian cancer cell viability, with Gli2 showing a novel contribution to cisplatin resistance.
Conclusions: These data indicate that ovarian tumors are enriched with CSCs and stem cell pathway mediators, especially at the completion of primary therapy. This suggests that stem cell subpopulations contribute to tumor chemoresistance and ultimately recurrent disease.
Figures
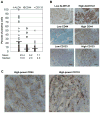
Figure 1. Change in expression of ALDH1A1, CD44 and CD133 from primary to recurrent ovarian cancer
A) ALDH1A1, CD44 and CD133 expression in 45 high grade ovarian adenocarcinomas was examined using immunohistochemistry. The estimated percentage of positive cells for each sample, with mean (black bars) and median, are shown. B) For all three proteins examined, staining was heterogeneous, rather than diffusely positive. Examples of high and low frequency expression for each are shown (black bar = 100 μm). C) A higher magnification of CD44 and CD133 expression in primary ovarian cancer specimens, demonstrating cell surface expression. D) The average number of positive cells for ALDH1A1, CD44 and CD133 among the 45 primary samples was compared to the average among matched recurrent samples. Only CD133 was significantly higher in recurrent samples. Error bars represent SEM. *P<0.001. E) In order to evaluate the change in each subpopulation for each patient, in addition to the mean of the entire group, the change for each tumor is shown in individual graphs.
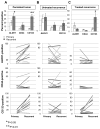
Figure 2. Subgroup analysis of ALDH1A1, CD44 and CD133 based on setting of recurrent tumor collection
Expression of ALDH1A1, CD44 and CD133 was broken down into subcategories based on the setting in which the recurrent tumor was retrieved. A) ALDH1A1, CD44 and CD133 expression was higher in samples collected immediately after the completion of primary therapy (persistent tumor; n=12). B) Samples collected at first recurrence before initiating secondary therapy (untreated recurrence; n=20) were composed of similar percentages of each marker. C) In tumors collected from recurrent, platinum-resistant patients (treated recurrence; n=13), only CD133 was increased in expression. Error bars represent SEM. *P<0.05, **P<0.01.
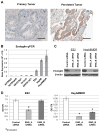
Figure 3. Endoglin is expressed in persistent ovarian tumor and ovarian cancer cell lines and its downregulation leads to decreased cell viability.<
A) Matched primary/persistent ovarian tumor pairs (n = 12) were subjected to immunohistochemical analysis of endoglin to evaluate changes in expression. Persistent tumors were found to have a higher density of endoglin staining compared to primary specimens. Representative histologic sections are shown for a matched pair (black bar = 100 μm). B) mRNA expression of endoglin was quantified in 8 different ovarian cancer cell lines using quantitative PCR. Gene expression is shown as log2 transformed ΔCT values (difference between the CT value of the gene of interest (endoglin) and that of the housekeeping gene (RPLP0)). C) Downregulation of endoglin in ES2 and HeyA8MDR cells using 2 different siRNA constructs was determined by Western blot analysis. βactin was used as a loading control. D) ES2 and HeyA8MDR cells transiently transfected with anti-endoglin siRNAs had decreased viability as determined by MTT assay. E) Cell cycle analysis (PI staining) revealed that downregulation of endoglin led to an accumulation of both ES2 and HeyA8MDR cells in the sub-G0 or apoptotic fraction. Data are representative of 3 independent experiments. *P<0.001.
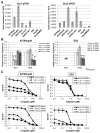
Figure 4. Downregulation of Gli1/2 leads to decreased cell viability and downregulation of Gli2, but not Gli1, sensitizes ovarian cancer cells to cisplatin in vitro
A) mRNA expression of GLI1 and GLI2 was quantified in 8 different ovarian cancer cell lines using quantitative PCR. Gene expression is shown as log2 transformed ΔC T values. B) Downregulation of Gli1/2 in A2780cp20 and ES2 cells using 2 different siRNA constructs was determined by quantitative PCR. Each siRNA construct demonstrated selectivity for the GLI gene to which it was designed against. ND = not detectable; *P<0.01. C) Knockdown of Gli1 or Gli2 alone diminished A2780cp20 cell viability, whereas only knockdown of Gli2 diminished ES2 cell viability as determined by MTT assay. Increased sensitivity to cisplatin (CDDP) was noted in A2780cp20 and ES2 cells transfected with GLI2 siRNAs, but not GLI1 siRNAs. D) Cell cycle analysis (PI staining) of A2780cp20 cells exposed to control siRNA, GLI1 siRNA or GLI2 siRNA for a total of 72 hours. Downregulation of Gli2, and to a lesser extent Gli1, led to an accumulation of cells in the sub-G0 or apoptotic fraction. Data are representative of 3 independent experiments.
Similar articles
- ALDH activity selectively defines an enhanced tumor-initiating cell population relative to CD133 expression in human pancreatic adenocarcinoma.
Kim MP, Fleming JB, Wang H, Abbruzzese JL, Choi W, Kopetz S, McConkey DJ, Evans DB, Gallick GE. Kim MP, et al. PLoS One. 2011;6(6):e20636. doi: 10.1371/journal.pone.0020636. Epub 2011 Jun 13. PLoS One. 2011. PMID: 21695188 Free PMC article. - CD44+ CD133+ population exhibits cancer stem cell-like characteristics in human gallbladder carcinoma.
Shi C, Tian R, Wang M, Wang X, Jiang J, Zhang Z, Li X, He Z, Gong W, Qin R. Shi C, et al. Cancer Biol Ther. 2010 Dec 1;10(11):1182-90. doi: 10.4161/cbt.10.11.13664. Epub 2010 Dec 1. Cancer Biol Ther. 2010. PMID: 20948317 - A rational approach for cancer stem-like cell isolation and characterization using CD44 and prominin-1(CD133) as selection markers.
Lee YJ, Wu CC, Li JW, Ou CC, Hsu SC, Tseng HH, Kao MC, Liu JY. Lee YJ, et al. Oncotarget. 2016 Nov 29;7(48):78499-78515. doi: 10.18632/oncotarget.12100. Oncotarget. 2016. PMID: 27655682 Free PMC article. - Epithelial ovarian cancer stem cells: underlying complexity of a simple paradigm.
Garson K, Vanderhyden BC. Garson K, et al. Reproduction. 2015 Feb;149(2):R59-70. doi: 10.1530/REP-14-0234. Epub 2014 Oct 9. Reproduction. 2015. PMID: 25301968 Review. - Clinical implications of cancer stem cell biology in hepatocellular carcinoma.
Ji J, Wang XW. Ji J, et al. Semin Oncol. 2012 Aug;39(4):461-72. doi: 10.1053/j.seminoncol.2012.05.011. Semin Oncol. 2012. PMID: 22846863 Free PMC article. Review.
Cited by
- Integrated analysis of gene expression profiles associated with response of platinum/paclitaxel-based treatment in epithelial ovarian cancer.
Han Y, Huang H, Xiao Z, Zhang W, Cao Y, Qu L, Shou C. Han Y, et al. PLoS One. 2012;7(12):e52745. doi: 10.1371/journal.pone.0052745. Epub 2012 Dec 27. PLoS One. 2012. PMID: 23300757 Free PMC article. - VCAM1 expression correlated with tumorigenesis and poor prognosis in high grade serous ovarian cancer.
Huang J, Zhang J, Li H, Lu Z, Shan W, Mercado-Uribe I, Liu J. Huang J, et al. Am J Transl Res. 2013 Apr 19;5(3):336-46. Print 2013. Am J Transl Res. 2013. PMID: 23634244 Free PMC article. - Targeting epithelial-mesenchymal transition and cancer stem cells for chemoresistant ovarian cancer.
Deng J, Wang L, Chen H, Hao J, Ni J, Chang L, Duan W, Graham P, Li Y. Deng J, et al. Oncotarget. 2016 Aug 23;7(34):55771-55788. doi: 10.18632/oncotarget.9908. Oncotarget. 2016. PMID: 27304054 Free PMC article. Review. - The Metabolic Inhibitor CPI-613 Negates Treatment Enrichment of Ovarian Cancer Stem Cells.
Bellio C, DiGloria C, Spriggs DR, Foster R, Growdon WB, Rueda BR. Bellio C, et al. Cancers (Basel). 2019 Oct 29;11(11):1678. doi: 10.3390/cancers11111678. Cancers (Basel). 2019. PMID: 31671803 Free PMC article. - Cancer Stem Cells in Ovarian Cancer-A Source of Tumor Success and a Challenging Target for Novel Therapies.
Wilczyński JR, Wilczyński M, Paradowska E. Wilczyński JR, et al. Int J Mol Sci. 2022 Feb 24;23(5):2496. doi: 10.3390/ijms23052496. Int J Mol Sci. 2022. PMID: 35269636 Free PMC article. Review.
References
- Bhoola S, Hoskins WJ. Diagnosis and management of epithelial ovarian cancer. Obstet Gynecol. 2006;107:1399–410. - PubMed
- Dalerba P, Cho RW, Clarke MF. Cancer stem cells: models and concepts. Annu Rev Med. 2007;58:267–84. - PubMed
Publication types
MeSH terms
Substances
Grants and funding
- K12 HD000849/HD/NICHD NIH HHS/United States
- L30 CA135771-01/CA/NCI NIH HHS/United States
- UL1 RR025777/RR/NCRR NIH HHS/United States
- K12 HD00849/HD/NICHD NIH HHS/United States
- L30 CA135771/CA/NCI NIH HHS/United States
- 5UL1RR025777/RR/NCRR NIH HHS/United States
- K12 HD000849-21/HD/NICHD NIH HHS/United States
LinkOut - more resources
Full Text Sources
Other Literature Sources
Medical
Research Materials
Miscellaneous


