Both p110α and p110β isoforms of PI3K can modulate the impact of loss-of-function of the PTEN tumour suppressor - PubMed (original) (raw)
Both p110α and p110β isoforms of PI3K can modulate the impact of loss-of-function of the PTEN tumour suppressor
Inma M Berenjeno et al. Biochem J. 2012.
Abstract
The PI3K (phosphoinositide 3-kinase) pathway is commonly activated in cancer as a consequence of inactivation of the tumour suppressor PTEN (phosphatase and tensin homologue deleted on chromosome 10), a major negative regulator of PI3K signalling. In line with this important role of PTEN, mice that are heterozygous for a PTEN-null allele (PTEN+/− mice) spontaneously develop a variety of tumours in multiple organs. PTEN is a phosphatase with selectivity for PtdIns(3,4,5)P3, which is produced by the class I isoforms of PI3K (p110α, p110β, p110γ and p110δ). Previous studies indicated that PTEN-deficient cancer cell lines mainly depend on p110β, and that p110β, but not p110α, controls mouse prostate cancer development driven by PTEN loss. In the present study, we investigated whether the ubiquitously expressed p110α can also functionally interact with PTEN in cancer. Using genetic mouse models that mimic systemic administration of p110α- or p110β-selective inhibitors, we confirm that inactivation of p110β, but not p110α, inhibits prostate cancer development in PTEN+/− mice, but also find that p110α inactivation protects from glomerulonephritis, pheochromocytoma and thyroid cancer induced by PTEN loss. This indicates that p110α can modulate the impact of PTEN loss in disease and tumourigenesis. In primary and immortalized mouse fibroblast cell lines, both p110α and p110β controlled steady-state PtdIns(3,4,5)P3 levels and Akt signalling induced by heterozygous PTEN loss. In contrast, no correlation was found in primary mouse tissues between PtdIns(3,4,5)P3 levels, PI3K/PTEN genotype and cancer development. Taken together, our results from the present study show that inactivation of either p110α or p110β can counteract the impact of PTEN inactivation. The potential implications of these findings for PI3K-targeted therapy of cancer are discussed.
Figures
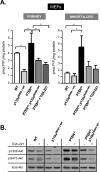
Figure 1. PI3K signalling upon inactivation of p110α or p110β in MEFs
(A) Cellular PtdIns(3,4,5)_P_3 (PIP3) levels in primary (left-hand panel) and immortalized (right-hand panel) MEFs of the indicated genotype. Where indicated, TGX-221 was added at 500 nM for 16 h, with control PTEN+/− cells incubated with vehicle only. Results from one experiment performed in triplicate are shown. The results shown are the means±S.E.M. *P<0.05 as obtained by Student's t test (Mann–Whitney). (B) MEFs of the indicated genotype were cultured in 10% FBS in the presence of 500 nM TGX-221 or vehicle for 16 h, followed by cell lysis and immunoblotting with the indicated antibodies against Akt.
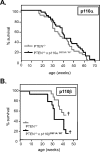
Figure 2. Impact of inactivation of one allele of p110α or p110β on survival of PTEN+/− mice
(A) Survival curves of PTEN+/− and PTEN+/−×p110αD933A/WT mice. The number of mice used were: PTEN+/−, _n_=31 (16 females, 15 males); and PTEN+/−×p110αD933A/WT, _n_=29 (12 females, 15 males) (Mantel–Cox test, _P_=0.2036; Gehan–Breslow–Wilcoxon test, _P_=0.2617). (B) Survival curve of PTEN+/− and PTEN+/−×p110βD931A/WT mice. The number of mice used were: PTEN+/−, _n_=16 (6 females, 10 males); and PTEN+/−×p110βD933A/WT, _n_=14 (8 females, 6 males) (Mantel–Cox test, _P_=0.3380; Gehan–Breslow–Wilcoxon test, _P_=0.1279). †the p110β cohort was terminated at 42 weeks of age.
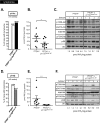
Figure 3. PtdIns(3,4,5)_P_3 levels and PI3K/Akt signalling in PTEN+/−×p110αD933A/WT and PTEN+/−×p110βD931A/WT lymphomas
(A) Incidence of lymphoma in PTEN+/−×p110αD933A/WT (_n_=30) and littermate control PTEN+/− mice (_n_=27). (B) PtdIns(3,4,5)_P_3 levels in lipid extracts isolated from PTEN+/−×p110αD933A/WT and control PTEN+/− lymphoma tissue from age-matched mice. Number of tissue samples used: PTEN+/−, _n_=9; and PTEN+/−×p110αD933A/WT, _n_=10. *P<0.05 as obtained by the Student's t test (Mann–Whitney). (C) Lymphoma protein extracts from the indicated mice were immunoblotted with the indicated antibodies. Tumour samples from four different mice were analysed per genotype. The PtdIns(3,4,5)_P_3 (PIP3) levels in each sample are indicated. (D) Incidence of lymphoma in PTEN+/−×p110βD931A/WT mice (_n_=14) and littermate control PTEN+/− mice (_n_=20). (E) PtdIns(3,4,5)_P_3 levels in lipid extracts isolated from PTEN+/−×p110βD933A/WT and control PTEN+/− lymphoma tissue from age-matched mice. Number of tissue samples used: PTEN+/−×p110βD931A/WT, _n_=5; and PTEN+/−, _n_=10. *P<0.05 as obtained by the Student's t test (Mann–Whitney). (F) Lymphoma protein extracts from the indicated mice were immunoblotted with the indicated antibodies. Tumour samples from four different mice were analysed per genotype. The PtdIns(3,4,5)_P_3 levels in each sample are indicated.
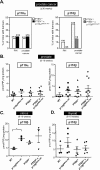
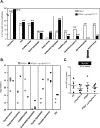
Figure 4. Impact of inactivation of one allele of p110α or p110β on the development of PIN and prostate cancer, and on PtdIns(3,4,5)_P_3 levels in prostate, uterus and thyroid tissue
(A) Incidence of PIN and prostate cancer in PTEN+/−×p110αD933A/WT mice (left-hand panel, closed bars) and PTEN+/−×p110βD931A/WT mice (right-hand panel, grey bars), compared with PTEN+/− mice. Two independent PTEN+/− control cohorts were used, for the p110α (open bars) and the p110β mice (dotted bars). (B, C and D) PtdIns(3,4,5)_P_3 (PIP3) levels in prostate, uterus and thyroid tissue from 8–10-week-old mice of the indicated genotypes. *P<0.05 as obtained by Student's t test (Mann–Whitney).
Figure 5. Impact of p110α inactivation on PTEN+/− tumours and pathologies
(A) Tumour spectrum and incidence in PTEN+/− and PTEN+/−×p110αD933A/WT mice. Number of mice used: PTEN+/−, _n_=27 (14 females, 13 males); and PTEN+/−×p110α+/−, _n_=30 (14 females, 16 males). The tumours/pathologies are grouped according to either no change, slightly increased or decreased upon p110α inactivation. (B) Timing of appearance of some of the tumours/pathologies shown in (A). (C) PtdIns(3,4,5)_P_3 (PIP3) levels in lipid extracts isolated from thyroid tissue from 8–10-week-old mice of the indicated genotypes.
Similar articles
- PI3K isoform dependence of PTEN-deficient tumors can be altered by the genetic context.
Schmit F, Utermark T, Zhang S, Wang Q, Von T, Roberts TM, Zhao JJ. Schmit F, et al. Proc Natl Acad Sci U S A. 2014 Apr 29;111(17):6395-400. doi: 10.1073/pnas.1323004111. Epub 2014 Apr 15. Proc Natl Acad Sci U S A. 2014. PMID: 24737887 Free PMC article. - PI3K-p110α mediates resistance to HER2-targeted therapy in HER2+, PTEN-deficient breast cancers.
Wang Q, Liu P, Spangle JM, Von T, Roberts TM, Lin NU, Krop IE, Winer EP, Zhao JJ. Wang Q, et al. Oncogene. 2016 Jul 7;35(27):3607-12. doi: 10.1038/onc.2015.406. Epub 2015 Oct 26. Oncogene. 2016. PMID: 26500061 Free PMC article. - Combined Inhibition of Both p110α and p110β Isoforms of Phosphatidylinositol 3-Kinase Is Required for Sustained Therapeutic Effect in PTEN-Deficient, ER+ Breast Cancer.
Hosford SR, Dillon LM, Bouley SJ, Rosati R, Yang W, Chen VS, Demidenko E, Morra RP Jr, Miller TW. Hosford SR, et al. Clin Cancer Res. 2017 Jun 1;23(11):2795-2805. doi: 10.1158/1078-0432.CCR-15-2764. Epub 2016 Nov 30. Clin Cancer Res. 2017. PMID: 27903677 Free PMC article. - Class I Phosphoinositide 3-Kinase PIK3CA/p110α and PIK3CB/p110β Isoforms in Endometrial Cancer.
Mazloumi Gavgani F, Smith Arnesen V, Jacobsen RG, Krakstad C, Hoivik EA, Lewis AE. Mazloumi Gavgani F, et al. Int J Mol Sci. 2018 Dec 7;19(12):3931. doi: 10.3390/ijms19123931. Int J Mol Sci. 2018. PMID: 30544563 Free PMC article. Review. - The INPP4B paradox: Like PTEN, but different.
Hamila SA, Ooms LM, Rodgers SJ, Mitchell CA. Hamila SA, et al. Adv Biol Regul. 2021 Dec;82:100817. doi: 10.1016/j.jbior.2021.100817. Epub 2021 Jun 16. Adv Biol Regul. 2021. PMID: 34216856 Review.
Cited by
- Inhibition of class IA PI3K enzymes in non-small cell lung cancer cells uncovers functional compensation among isoforms.
Stamatkin C, Ratermann KL, Overley CW, Black EP. Stamatkin C, et al. Cancer Biol Ther. 2015;16(9):1341-52. doi: 10.1080/15384047.2015.1070986. Epub 2015 Jul 15. Cancer Biol Ther. 2015. PMID: 26176612 Free PMC article. - The role of PI3'-lipid signalling in melanoma initiation, progression and maintenance.
Parkman GL, Foth M, Kircher DA, Holmen SL, McMahon M. Parkman GL, et al. Exp Dermatol. 2022 Jan;31(1):43-56. doi: 10.1111/exd.14489. Epub 2021 Nov 9. Exp Dermatol. 2022. PMID: 34717019 Free PMC article. Review. - Molecules in medicine mini-review: isoforms of PI3K in biology and disease.
Vanhaesebroeck B, Whitehead MA, Piñeiro R. Vanhaesebroeck B, et al. J Mol Med (Berl). 2016 Jan;94(1):5-11. doi: 10.1007/s00109-015-1352-5. Epub 2015 Dec 10. J Mol Med (Berl). 2016. PMID: 26658520 Review. - Capillary Isoelectric Focusing of Akt Isoforms Identifies Highly Dynamic Phosphorylation in Neuronal Cells and Brain Tissue.
Schrötter S, Leondaritis G, Eickholt BJ. Schrötter S, et al. J Biol Chem. 2016 May 6;291(19):10239-51. doi: 10.1074/jbc.M115.700138. Epub 2016 Mar 4. J Biol Chem. 2016. PMID: 26945062 Free PMC article. - Spatially distinct roles of class Ia PI3K isoforms in the development and maintenance of PTEN hamartoma tumor syndrome.
Wang Q, Von T, Bronson R, Ruan M, Mu W, Huang A, Maira SM, Zhao JJ. Wang Q, et al. Genes Dev. 2013 Jul 15;27(14):1568-80. doi: 10.1101/gad.216069.113. Genes Dev. 2013. PMID: 23873941 Free PMC article.
References
- Vanhaesebroeck B., Leevers S. J., Panayotou G., Waterfield M. D. Phosphoinositide 3-kinases: a conserved family of signal transducers. Trends Biochem. Sci. 1997;22:267–272. - PubMed
- Cantley L. C. The phosphoinositide 3-kinase pathway. Science. 2002;296:1655–1657. - PubMed
- Vanhaesebroeck B., Guillermet-Guibert J., Graupera M., Bilanges B. The emerging mechanisms of isoform-specific PI3K signalling. Nat. Rev. Mol. Cell Biol. 2010;11:329–341. - PubMed
- Steck P. A., Pershouse M. A., Jasser S. A., Yung W. K., Lin H., Ligon A. H., Langford L. A., Baumgard M. L., Hattier T., Davis T., et al. Identification of a candidate tumour suppressor gene, MMAC1, at chromosome 10q23.3 that is mutated in multiple advanced cancers. Nat. Genet. 1997;15:356–362. - PubMed
- Li J., Yen C., Liaw D., Podsypanina K., Bose S., Wang S. I., Puc J., Miliaresis C., Rodgers L., McCombie R., et al. PTEN, a putative protein tyrosine phosphatase gene mutated in human brain, breast, and prostate cancer. Science. 1997;275:1943–1947. - PubMed
Publication types
MeSH terms
Substances
LinkOut - more resources
Full Text Sources
Research Materials
