Global DNA hypomethylation coupled to repressive chromatin domain formation and gene silencing in breast cancer - PubMed (original) (raw)
doi: 10.1101/gr.125872.111. Epub 2011 Dec 7.
R David Hawkins, Otavia L Caballero, Christine Lo, Ryan Lister, Mattia Pelizzola, Armand Valsesia, Zhen Ye, Samantha Kuan, Lee E Edsall, Anamaria Aranha Camargo, Brian J Stevenson, Joseph R Ecker, Vineet Bafna, Robert L Strausberg, Andrew J Simpson, Bing Ren
Affiliations
- PMID: 22156296
- PMCID: PMC3266032
- DOI: 10.1101/gr.125872.111
Global DNA hypomethylation coupled to repressive chromatin domain formation and gene silencing in breast cancer
Gary C Hon et al. Genome Res. 2012 Feb.
Abstract
While genetic mutation is a hallmark of cancer, many cancers also acquire epigenetic alterations during tumorigenesis including aberrant DNA hypermethylation of tumor suppressors, as well as changes in chromatin modifications as caused by genetic mutations of the chromatin-modifying machinery. However, the extent of epigenetic alterations in cancer cells has not been fully characterized. Here, we describe complete methylome maps at single nucleotide resolution of a low-passage breast cancer cell line and primary human mammary epithelial cells. We find widespread DNA hypomethylation in the cancer cell, primarily at partially methylated domains (PMDs) in normal breast cells. Unexpectedly, genes within these regions are largely silenced in cancer cells. The loss of DNA methylation in these regions is accompanied by formation of repressive chromatin, with a significant fraction displaying allelic DNA methylation where one allele is DNA methylated while the other allele is occupied by histone modifications H3K9me3 or H3K27me3. Our results show a mutually exclusive relationship between DNA methylation and H3K9me3 or H3K27me3. These results suggest that global DNA hypomethylation in breast cancer is tightly linked to the formation of repressive chromatin domains and gene silencing, thus identifying a potential epigenetic pathway for gene regulation in cancer cells.
Figures
Figure 1.
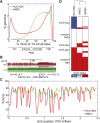
Global hypomethylation in breast cancer. (A) Distribution of %mCG for all 10-kb windows in the human genome. Quartiles of increasing %mCG are labeled as low, mid-low, mid-high, and high %mCG, with mid-low and mid-high representing partially methylated domains (PMDs). (B) A large domain of hypomethylation near the DACH1 tumor suppressor. (Red) HCC1954, (green) HMEC. (C) Distribution of %mCG on chromosome 2 for the breast cancer cell line HCC1954 and the normal breast line HMEC. (D) A heatmap of low, PMD, and high %mCG for all 10-kb windows in the human genome. Each of the 282,109 rows represents the mCG status for a 10-kb window in HCC1954, HMEC, and IMR90 fibroblast cells. The dendrogram represents the similarity (Pearson correlation) of the profiles across different cells.
Figure 2.
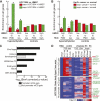
Gene body hypomethylation is associated with gene repression. (A) Genes were overlapped with 10-kb domains undergoing hypomethylation (high to PMD, PMD to low) or control (low to low, PMD to PMD, high to high) transitions. Shown is the enrichment of each transition state with genes having HCC1954 expression at least eightfold more (red) or less (green) than HMEC, when compared to the global enrichment of all transition states. (*) _P_-value ≤ 0.01 (hypergeometric). (B) Using the same transition states in A, but comparing the expression of genes in a panel of 50 ERBB2+ (HER2+) breast cancers compared to a panel of 23 normal breast samples (Weigelt et al. 2005; Oh et al. 2006; Perreard et al. 2006; Herschkowitz et al. 2007, 2008; Hoadley et al. 2007; Mullins et al. 2007; Hennessy et al. 2009; Hu et al. 2009; Parker et al. 2009; Prat et al. 2010). Significantly more (red) or less (green) expressed genes are defined by a Wilcoxon rank sum test (_P_-value ≤ 0.01) between the expression values of the two different panels. (*) Enrichment _P_-value ≤ 0.01 (hypergeometric). (C) Functional enrichment of hypomethylated genes having loss of expression by the DAVID analysis tool (Dennis et al. 2003). (D) Epigenetic status of genes undergoing hypomethylation in gene bodies with loss of expression. With the exception of H3K9me3, all values are of HCC1954 relative to HMEC. RNA, log2 (HCC1954 RPKM/HMEC RPKM); ΔmCG, log2 (HCC1954%mCG/HMEC %mCG); Δhistone, log2 (HCC1954 ChIP/input) − log2 (HMEC ChIP/input); H3K9me3, log2 (HCC1954 ChIP/input). (Onc) oncogene, (TS) tumor suppressor.
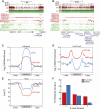
Figure 3.
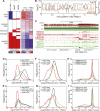
Repressive chromatin is depleted of mCG. (A) (Left) A reproduction of Figure 1D; (right) each of the 282,109 rows represents the H3K9me3 (denoted K9) and H3K27me3 (denoted K27) status in HCC1954 and HMEC, in the same order as the left panel. (B) Distribution of %mCG, H3K9me3, and H3K27me3 on chromosome 2 for HCC1954. (C) A large domain of DNA hypomethylation near the DACH1 tumor suppressor coincides with H3K9me3 and H3K27me3 in HCC1954. (Red) HCC1954, (green) HMEC. (D) Distribution of H3K9me3 enrichment for four quantiles of DNA methylation status in HCC1954. (E) As in D, but for H3K27me3. (F) Distribution of change in H3K9me3 in HCC1954 compared with IMR90 for 10-kb windows that lose mCG, gain mCG, or are unchanged for mCG. Δlog2 (H3K9me3) = log2 (HCC1954 H3K9me3/input) − log2 (IMR90 H3K9me3/input). (G) As in F, but for H3K27me3 comparing HCC1954 with HMEC. (H) Distribution of change in mCG in HCC1954 compared with IMR90 for 10-kb windows that lose H3K9me3, gain H3K9me3, or are unchanged for H3K9me3. (I) As in H, but for H3K27me3 comparing HCC1954 with HMEC.
Figure 4.
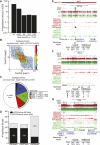
Allelic distribution of epigenetic modifications. (A) Number of haplotype blocks found by SNP phasing (denoted all), and the number of these blocks showing significant allelic bias for mCG, H3K9me3 (denoted K9), H3K27me3 (denoted K27), and H3K36me3 (denoted K36) (Fisher's exact test _P_-value ≤ 0.05). (B) For haplotype blocks where the combined frequency of methylation of both haplotypes is between 40% and 60%, shown is the density plot of %mCG on haplotype 1 versus %mCG on haplotype 2. (C) For haplotype blocks in B, shown is the fraction with allelic bias (Fisher's exact test _P_-value ≤ 0.05), for different possible values of allelic bias. ΔmCG = |%mCG(hap1) − %mCG(hap2)|. (D) Of haplotype blocks simultaneously showing allelic bias in mCG (Fisher's exact test _P_-value ≤ 0.05, ΔmCG ≥ 50%) and a histone modification (Fisher's exact test _P_-value ≤ 0.05), the number of haplotype blocks where mCG is on the same or different allele as the histone modification. (E) Allelic H3K36me3 at the MAGED2 gene. The bar at top indicates where one arm of chrX was lost. (Red) HCC1954, (green) HMEC. (Bottom) Number of H3K36me3 reads belonging to haplotype 1 or 2. (F) Allelic H3K27me3 at the MGMT tumor suppressor. (Red) HCC1954, (green) HMEC. (Bottom) Number of H3K27me3 reads belonging to haplotype 1 or 2. (G) Allelic H3K9me3 near the CADM1 tumor suppressor. (Red) HCC1954, (green) HMEC. (Bottom) Number of H3K9me3 reads belonging to haplotype 1 or 2.
Figure 5.
Mutual exclusiveness of chromatin modifications and mCG by ChIP-methylC-seq. ChIP was performed for H3K9me3, H3K27me3, or H3K36me3 in HCC1954, followed by bisulfite conversion and sequencing. For 10-kb windows, mCG bias was compared to genomic background from methylC-seq (P ≤ 0.01, Fisher's exact test). Shown is the number of 10-kb windows showing significant differences, split by whether there is more or less mCG in the ChIP-methylC-seq sample.
Figure 6.
Large-scale organization of H3K9me3 and H3K27me3. (A) Hypomethylation near the DCC tumor suppressor coincides with H3K9me3, which is flanked by H3K27me3. (B) Hypomethylation near the DLC1 tumor suppressor coincides with H3K9me3, which is flanked by H3K27me3. (C) Enrichment of H3K9me3 within 2 Mb of H3K9me3 domains in HCC1954 and IMR90. (D) Enrichment of H3K27me3 within 2 Mb of H3K9me3 domains in HCC1954 and IMR90. (E) Enrichment of mCG within 2 Mb of H3K9me3 domains in HCC1954 and IMR90. (F) Fraction of H3K9me3 domains flanked by 0, 1, or 2 H3K27me3 domains.
Figure 7.
A passive model of hypomethylation. (A) Distribution of HCC1954 %mCG for exonic (top), genic (middle), and intergenic (bottom) cytosine residues. (B) Distribution of HCC1954 %mCG for 10-kb regions that are consistently early-, middle-, and late-replicating in four cell types (Hansen et al. 2009), compared to the background genome (green). (C) Snapshots illustrating the overlap of hypomethylated regions with lamina-associated domains previously mapped in Tig3 cells (Guelen et al. 2008), at the DACH1 (top) and DCC (bottom) genes. (D) Distribution of HCC1954 %mCG for 10-kb regions that are found in Tig3 lamina-associated domains (blue), compared to the background genome (gray).
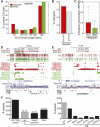
Figure 8.
Epigenetic contribution of increased repeat expression. (A) Distribution of %mCG of each repeat-associated cytosine residue spanned by at least 10 methylC-seq reads. (B) Percentage of all repeats (gray) and of lowly methylated repeats in HCC1954 (red) that are intergenic. (C) Distribution of intergenic repeat expression in HCC1954 and HMEC, expressed in RPKM. (White line) median, (box) 25th to 75th percentiles. (D) Snapshot of repeat expression and read-through with epigenetic signatures near the SERINC2 gene. RNA-seq strand distribution shown on top. (E) Snapshot of repeat expression and read-through with epigenetic signatures near the PLA2G2F gene. RNA-seq strand distribution shown on top. (F) Number of highly expressed repeats specific to HCC1954 and the number that can be explained by at least a 50% change in epigenetic modifications or read-through transcription from nearby repeats. (Epi) epigenetic.
Similar articles
- An integrated genomics analysis of epigenetic subtypes in human breast tumors links DNA methylation patterns to chromatin states in normal mammary cells.
Holm K, Staaf J, Lauss M, Aine M, Lindgren D, Bendahl PO, Vallon-Christersson J, Barkardottir RB, Höglund M, Borg Å, Jönsson G, Ringnér M. Holm K, et al. Breast Cancer Res. 2016 Feb 29;18(1):27. doi: 10.1186/s13058-016-0685-5. Breast Cancer Res. 2016. PMID: 26923702 Free PMC article. - Aberrant de novo methylation of the p16INK4A CpG island is initiated post gene silencing in association with chromatin remodelling and mimics nucleosome positioning.
Hinshelwood RA, Melki JR, Huschtscha LI, Paul C, Song JZ, Stirzaker C, Reddel RR, Clark SJ. Hinshelwood RA, et al. Hum Mol Genet. 2009 Aug 15;18(16):3098-109. doi: 10.1093/hmg/ddp251. Epub 2009 May 28. Hum Mol Genet. 2009. PMID: 19477956 - UHRF1 is associated with epigenetic silencing of BRCA1 in sporadic breast cancer.
Jin W, Chen L, Chen Y, Xu SG, Di GH, Yin WJ, Wu J, Shao ZM. Jin W, et al. Breast Cancer Res Treat. 2010 Sep;123(2):359-73. doi: 10.1007/s10549-009-0652-2. Epub 2009 Nov 27. Breast Cancer Res Treat. 2010. PMID: 19943104 - Epigenetic interplay between histone modifications and DNA methylation in gene silencing.
Vaissière T, Sawan C, Herceg Z. Vaissière T, et al. Mutat Res. 2008 Jul-Aug;659(1-2):40-8. doi: 10.1016/j.mrrev.2008.02.004. Epub 2008 Feb 29. Mutat Res. 2008. PMID: 18407786 Review. - Epigenetic regulation of ARHI in breast and ovarian cancer cells.
Yu Y, Fujii S, Yuan J, Luo RZ, Wang L, Bao J, Kadota M, Oshimura M, Dent SR, Issa JP, Bast RC Jr. Yu Y, et al. Ann N Y Acad Sci. 2003 Mar;983:268-77. doi: 10.1111/j.1749-6632.2003.tb05981.x. Ann N Y Acad Sci. 2003. PMID: 12724231 Review.
Cited by
- Tumor editing suppresses innate and adaptive antitumor immunity and is reversed by inhibiting DNA methylation.
Zhang Y, Naderi Yeganeh P, Zhang H, Wang SY, Li Z, Gu B, Lee DJ, Zhang Z, Ploumakis A, Shi M, Wu H, Greer EL, Hide W, Lieberman J. Zhang Y, et al. Nat Immunol. 2024 Oct;25(10):1858-1870. doi: 10.1038/s41590-024-01932-8. Epub 2024 Aug 21. Nat Immunol. 2024. PMID: 39169233 - DBATE: database of alternative transcripts expression.
Bianchi V, Colantoni A, Calderone A, Ausiello G, Ferrè F, Helmer-Citterich M. Bianchi V, et al. Database (Oxford). 2013 Jul 9;2013:bat050. doi: 10.1093/database/bat050. Print 2013. Database (Oxford). 2013. PMID: 23842462 Free PMC article. - Developmental regulation and induction of cytochrome P450 2W1, an enzyme expressed in colon tumors.
Choong E, Guo J, Persson A, Virding S, Johansson I, Mkrtchian S, Ingelman-Sundberg M. Choong E, et al. PLoS One. 2015 Apr 6;10(4):e0122820. doi: 10.1371/journal.pone.0122820. eCollection 2015. PLoS One. 2015. PMID: 25844926 Free PMC article. - Tet-mediated covalent labelling of 5-methylcytosine for its genome-wide detection and sequencing.
Zhang L, Szulwach KE, Hon GC, Song CX, Park B, Yu M, Lu X, Dai Q, Wang X, Street CR, Tan H, Min JH, Ren B, Jin P, He C. Zhang L, et al. Nat Commun. 2013;4:1517. doi: 10.1038/ncomms2527. Nat Commun. 2013. PMID: 23443545 Free PMC article. - DNA methylation profiling in the clinic: applications and challenges.
Heyn H, Esteller M. Heyn H, et al. Nat Rev Genet. 2012 Oct;13(10):679-92. doi: 10.1038/nrg3270. Epub 2012 Sep 4. Nat Rev Genet. 2012. PMID: 22945394 Review.
References
- Aran D, Toperoff G, Rosenberg M, Hellman A 2011. Replication timing-related and gene body-specific methylation of active human genes. Hum Mol Genet 20: 670–680 - PubMed
- Bansal V, Bafna V 2008. HapCUT: An efficient and accurate algorithm for the haplotype assembly problem. Bioinformatics 24: i153–i159 - PubMed
Publication types
MeSH terms
Substances
LinkOut - more resources
Full Text Sources
Other Literature Sources
Medical
