Active action potential propagation but not initiation in thalamic interneuron dendrites - PubMed (original) (raw)
Active action potential propagation but not initiation in thalamic interneuron dendrites
Amanda E Casale et al. J Neurosci. 2011.
Abstract
Inhibitory interneurons of the dorsal lateral geniculate nucleus of the thalamus modulate the activity of thalamocortical cells in response to excitatory input through the release of inhibitory neurotransmitter from both axons and dendrites. The exact mechanisms by which release can occur from dendrites are, however, not well understood. Recent experiments using calcium imaging have suggested that Na/K-based action potentials can evoke calcium transients in dendrites via local active conductances, making the backpropagating action potential a candidate for dendritic neurotransmitter release. In this study, we used high temporal and spatial resolution voltage-sensitive dye imaging to assess the characteristics of dendritic voltage deflections in response to Na/K action potentials in interneurons of the mouse dorsal lateral geniculate nucleus. We found that trains or single action potentials elicited by somatic current injection or local synaptic stimulation rapidly and actively backpropagated throughout the entire dendritic arbor and into the fine filiform dendritic appendages known to release GABAergic vesicles. Action potentials always appeared first in the soma or proximal dendrite in response to somatic current injection or local synaptic stimulation, and the rapid backpropagation into the dendritic arbor depended upon voltage-gated sodium and tetraethylammonium chloride-sensitive potassium channels. Our results indicate that thalamic interneuron dendrites integrate synaptic inputs that initiate action potentials, most likely in the axon initial segment, that then backpropagate with high fidelity into the dendrites, resulting in a nearly synchronous release of GABA from both axonal and dendritic compartments.
Figures
Figure 1.
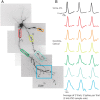
Action potentials propagate throughout the dendritic arbor. A, Voltage-sensitive dye (VSD) fluorescence confocal z_-projection of an LGNd interneuron. Colored boxes are regions of interest for optical recordings in B. B, Electrical and optical signals corresponding to three action potentials in a train initiated by a depolarizing step at the soma. Electrical and optical signals are an average of two trials. Black traces are somatic electrode recordings. Colored traces are optical signals (Δ_F/F) acquired at 2 kHz in the dendrite. Colored traces correspond to colored boxed regions in A. Optical traces are normalized to peak amplitude.
Figure 2.
Action potentials propagate into the dendritic arbor and into dendritic boutons. A, Confocal _z_-projection of a voltage-sensitive dye-filled interneuron. Colored boxes are regions of interest for optical recordings in B. B, Electrical and optical signals (average of four trials) of the first spike in a train elicited by a step depolarization at the soma. Optical traces were recorded at 10 kHz. Colored traces correspond to colored boxed regions in A. Note: gray trace demonstrates a lack of substantial light scatter, confirming that optical signals recorded are due to the dendritic region being imaged. C, Confocal _z_-projection of a voltage-sensitive dye-filled interneuron. The dendritic region indicated by the black box (expanded in D and E) was imaged with a resolution of 1 μm per pixel at a speed of 10 kHz. D, Magnified confocal _z_-projection of dendritic region imaged. Colored boxes refer to regions of interest for optical recording. E, Volume rendering of _z_-stack images of dendritic image shown in D. F, Electrical and optical signals (average of four trials) corresponding to the first action potential in a train elicited by a somatic step depolarization. Black trace is the electrical recording at the soma. Colored traces correspond to colored boxed regions of interest in D. Optical traces are normalized to peaks.
Figure 3.
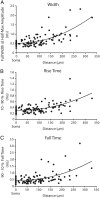
Action potentials become slower and broader as they propagate to the distal dendrite. A–C, Action potential full-width at half-height (n = 30; _R_2 = 0.47) (A), action potential 10–90% rise time (n = 30; _R_2 = 0.37) (B), action potential 90–10% fall time (n = 26; _R_2 = 0.3) (C) plotted as a function of distance along the dendrite from the soma. Data were fit with a second-order polynomial. The somatic values (point 0) were recorded optically.
Figure 4.
Action potentials occur first in the soma/proximal dendrite in response to a somatic step depolarization. A, Confocal z_-projection of a voltage-sensitive dye-filled interneuron. Colored boxes correspond to dendritic regions of interest. B, Electrical and optical signals corresponding to the first action potential in a train. Electrical and optical signals are an average of three trials. Black trace is the somatic electrode recording. Colored traces are optical signals (Δ_F/F) recorded at 10 kHz along the dendrite. Colored traces refer to colored regions of interest in A. Optical and electrical traces are normalized to peaks. C, Overlay of optical traces in B illustrating the timing of action potential occurrence in the dendrite. D, Scatter plot of the onset latency of the action potential in the dendrite as a function of distance (gray dots). Onset latency was defined as the difference between the time of half-maximum amplitude of the action potential at the dendrite and the soma. Black line shows average onset latencies for bins of 20 μm from 0 to 120 μm along the dendrite. From 120 to 150 μm, data averaged in 30 μm size bins. From 150 to 210 μm, data averaged in 60 μm size bins. Error bars indicate ±SEM. N = 14 cells in D. All data in plots are optical.
Figure 5.
Prolonged somatic depolarization elicits trains of action potentials that become progressively smaller in amplitude in both the soma and dendrite. A, Confocal _z_-projection of a voltage-sensitive dye-filled interneuron. Colored box refers to the dendritic region of interest during imaging. B, Example of a 50 ms step depolarization at the soma, which resulted in four action potentials for the cell in A. C, Single-trial example of the four action potentials elicited by the current step propagating into a dendritic branch. Optical trace was taken from the red boxed region in A. D, Overlay of four spikes; average of two trials. Spike number color coded as in C. Note the decay in action potential height with spike number.
Figure 6.
Action potential height decay during trains can be relieved using a 50 Hz depolarizing/hyperpolarizing stimulation protocol. A, Confocal _z_-projection of a voltage-sensitive dye-filled interneuron. Colored boxes refer to the dendritic regions of interest during imaging. B, Example of the 50 Hz stimulation protocol used to relieve spike height decay. C, Single-trial example of the multiple action potentials propagating into the dendrite in response to the stimulation protocol in B. Optical traces were taken from the color boxed regions of interest in A. Note the lack of extreme action potential height decay. D, Overlay of three action potentials in a 50 Hz train; average of two trials. E, Summary of action potential kinetics (amplitude, full-width at half-height; 10–90% rise time; 90–10% fall time) expressed as the percentage change between the first and third spike in a train. Black and gray bars refer to changes in action potential waveform at the soma and dendrite, respectively, in response to a 50 ms somatic current injection. Rose and pink bars refer to the changes in action potential waveform at the soma and dendrite, respectively, in response to the 50 Hz stimulation protocol (as shown in B).
Figure 7.
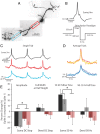
Action potentials rely on voltage-gated sodium channels to propagate into the dendrite. A, Confocal _z_-projection of a voltage-sensitive dye-filled interneuron. Colored boxes indicate dendritic regions of interest during imaging. B, Electrical and optical signals corresponding to an action potential or an injected action potential waveform in control or 1 μ
m
TTX conditions. Black trace is the action potential recorded by the electrode at the soma during control. This action potential served as the injected waveform in the presence of TTX. Colored traces correspond to data obtained from somatic and dendritic regions of interest seen in A during control conditions (average of three trials). Gray traces are fluorescence changes in response to the injected action potential waveform (average of 5 trials). C, Relative amplitude of the fluorescence (TTX/Control) plotted against distance along the dendrite. Gray circles represent somatic change. Black circles represent dendritic changes. D, Plot of action potential amplitude (Δ_F_/F) during TTX and control conditions. Gray circles represent somatic Δ_F_/F. Black circles represent dendritic Δ_F_/F. Black line represents unity. Only optical signals were compared at the soma. N = 5 cells.
Figure 8.
TEA-sensitive potassium channels control the repolarizing phase of the action potential. A–C, Left, Confocal _z_-projection of a voltage-sensitive dye-filled interneuron. Colored box refers to the dendritic region of interest during imaging. Right, examples of action potential waveform recorded electrically at the soma or optically in the dendrite during control, drug, and wash conditions. Concentrations: TEA 1 m
m
, IBTX 100 nM, α-DTX 100 n
m
. D, Summary of drug effects on the action potential full-width at half-height expressed as a percentage of control (average ± SEM). Black bars are somatic waveform changes recorded electrically (TEA: n = 6; IBTX: n = 5; α-DTX: n = 6 cells). Gray bars are dendritic waveform changes recorded optically (TEA: n = 4; IBTX: n = 4; α-DTX n = 5 cells).
Figure 9.
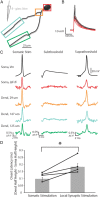
Action potentials elicited by either somatic current injection or local synaptic stimulation appeared first in or near the soma. A, Illustration of a voltage-sensitive dye-filled cell and theta-glass stimulator. Colored boxes correspond to somatic and dendritic regions of interest during imaging. B, Overlay of subthreshold (red) and suprathreshold (black) electrical signals recorded at the soma in response to local synaptic stimulation. Action potentials are truncated for clarity. C, Electrical and optical signals corresponding to action potentials elicited by somatic current injection (average of 2 trials), local synaptic stimulation resulting in subthreshold events (average of 10 trials), or local synaptic stimulation that elicited action potentials (average of 3 trials). Owing to variations in performance of the dye, differences in Δ_F_/F between locations is not necessarily indicative of differences in actual voltage. D, Onset latency of action potentials elicited by either somatic current injection or local synaptic stimulation. Onset latency is defined as the difference between the time of action potential half-height at the dendrite and soma. This difference was calculated for action potentials at the soma and the dendrite where EPSPs occurred first. Connected points correspond to a single cell in which action potentials were evoked somatically or synaptically (n = 5 cells). Gray bars are average onset latency ± SEM. Note that propagation speed decreased for action potentials elicited by local synaptic stimulation (p < 0.05).
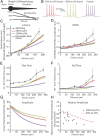
Figure 10.
A gradient of voltage-gated sodium and potassium channels along the dendrite can explain much of the broadening and slowing velocity of an action potential as it propagates away from the soma. A, Illustration of the model cell morphology. The simplified three-component morphology included an axon, cell body, and a single tapering dendrite. Black lines below the dendrite correspond to gradients in the sodium conductance along the dendrite as a percentage of that found in the soma (see Materials and Methods, Computer simulation). The potassium conductance followed the same linear percentage gradient as the sodium distribution for each condition, except during Passive where it was set to 50–25% of the somatic potassium conductance. B, Example of spiking behavior recorded at the soma in response to a 50 ms, 200 pA step depolarization at the model soma under each of the different dendritic conditions. C–F, Onset latency, full-width at half-height, 10–90% rise time, and 90–10% fall time of the first action potential in a train (elicited by a somatic step depolarization; 50 ms, 200 pA stimulation) recorded along the length of the dendrite. Dashed black lines correspond to experimental data collected using voltage-sensitive dyes. Experimental data were binned in 50 and 66 μm (Width, Rise Time, Fall Time) or 20, 30, and 60 μm (Soma to Dendrite Latency) segments (average ± SEM). G, Predicted action potential amplitude as a function of distance along the dendrite. H, In support of the model, the predicted ratio of action potential amplitude before and after TTX application versus distance along the dendrite is approximately correct.
Similar articles
- Propagation of action potentials in the dendrites of neurons from rat spinal cord slice cultures.
Larkum ME, Rioult MG, Lüscher HR. Larkum ME, et al. J Neurophysiol. 1996 Jan;75(1):154-70. doi: 10.1152/jn.1996.75.1.154. J Neurophysiol. 1996. PMID: 8822549 - Dichotomy of action-potential backpropagation in CA1 pyramidal neuron dendrites.
Golding NL, Kath WL, Spruston N. Golding NL, et al. J Neurophysiol. 2001 Dec;86(6):2998-3010. doi: 10.1152/jn.2001.86.6.2998. J Neurophysiol. 2001. PMID: 11731556 - Inhibition of backpropagating action potentials in mitral cell secondary dendrites.
Lowe G. Lowe G. J Neurophysiol. 2002 Jul;88(1):64-85. doi: 10.1152/jn.2002.88.1.64. J Neurophysiol. 2002. PMID: 12091533 - Complex regulation of dendritic transmitter release from thalamic interneurons.
Cox CL. Cox CL. Curr Opin Neurobiol. 2014 Dec;29:126-32. doi: 10.1016/j.conb.2014.07.004. Epub 2014 Jul 23. Curr Opin Neurobiol. 2014. PMID: 25062503 Free PMC article. Review. - Spatial distribution of NA+ and K+ channels in spinal dorsal horn neurones: role of the soma, axon and dendrites in spike generation.
Safronov BV. Safronov BV. Prog Neurobiol. 1999 Oct;59(3):217-41. doi: 10.1016/s0301-0082(98)00051-3. Prog Neurobiol. 1999. PMID: 10465379 Review.
Cited by
- Firing of hippocampal neurogliaform cells induces suppression of synaptic inhibition.
Li G, Stewart R, Canepari M, Capogna M. Li G, et al. J Neurosci. 2014 Jan 22;34(4):1280-92. doi: 10.1523/JNEUROSCI.3046-13.2014. J Neurosci. 2014. PMID: 24453319 Free PMC article. - Synaptic Contributions to Receptive Field Structure and Response Properties in the Rodent Lateral Geniculate Nucleus of the Thalamus.
Suresh V, Çiftçioğlu UM, Wang X, Lala BM, Ding KR, Smith WA, Sommer FT, Hirsch JA. Suresh V, et al. J Neurosci. 2016 Oct 26;36(43):10949-10963. doi: 10.1523/JNEUROSCI.1045-16.2016. J Neurosci. 2016. PMID: 27798177 Free PMC article. - The type of inhibition provided by thalamic interneurons alters the input selectivity of thalamocortical neurons.
Djama D, Zirpel F, Ye Z, Moore G, Chue C, Edge C, Jager P, Delogu A, Brickley SG. Djama D, et al. Curr Res Neurobiol. 2024 Apr 20;6:100130. doi: 10.1016/j.crneur.2024.100130. eCollection 2024. Curr Res Neurobiol. 2024. PMID: 38694514 Free PMC article. - Effects of Optogenetic Activation of Corticothalamic Terminals in the Motor Thalamus of Awake Monkeys.
Galvan A, Hu X, Smith Y, Wichmann T. Galvan A, et al. J Neurosci. 2016 Mar 23;36(12):3519-30. doi: 10.1523/JNEUROSCI.4363-15.2016. J Neurosci. 2016. PMID: 27013680 Free PMC article. - The subcellular distribution of T-type Ca2+ channels in interneurons of the lateral geniculate nucleus.
Allken V, Chepkoech JL, Einevoll GT, Halnes G. Allken V, et al. PLoS One. 2014 Sep 30;9(9):e107780. doi: 10.1371/journal.pone.0107780. eCollection 2014. PLoS One. 2014. PMID: 25268996 Free PMC article.
References
- Acuna-Goycolea C, Brenowitz SD, Regehr WG. Active dendritic conductances dynamically regulate GABA release from thalamic interneurons. Neuron. 2008;57:420–431. - PubMed
- Andersen P, Soleng AF, Raastad M. The hippocampal lamella hypothesis revisited. Brain Res. 2000;886:165–171. - PubMed
Publication types
MeSH terms
Substances
Grants and funding
- R01 EY012388/EY/NEI NIH HHS/United States
- R01 EY012388-11/EY/NEI NIH HHS/United States
- R01 NS060135/NS/NINDS NIH HHS/United States
- R01 NS060135-04/NS/NINDS NIH HHS/United States
LinkOut - more resources
Full Text Sources
Molecular Biology Databases
Miscellaneous
