Genomic distribution and inter-sample variation of non-CpG methylation across human cell types - PubMed (original) (raw)
. 2011 Dec;7(12):e1002389.
doi: 10.1371/journal.pgen.1002389. Epub 2011 Dec 8.
Fabian Müller, Jing Liao, Yingying Zhang, Hongcang Gu, Christoph Bock, Patrick Boyle, Charles B Epstein, Bradley E Bernstein, Thomas Lengauer, Andreas Gnirke, Alexander Meissner
Affiliations
- PMID: 22174693
- PMCID: PMC3234221
- DOI: 10.1371/journal.pgen.1002389
Genomic distribution and inter-sample variation of non-CpG methylation across human cell types
Michael J Ziller et al. PLoS Genet. 2011 Dec.
Abstract
DNA methylation plays an important role in development and disease. The primary sites of DNA methylation in vertebrates are cytosines in the CpG dinucleotide context, which account for roughly three quarters of the total DNA methylation content in human and mouse cells. While the genomic distribution, inter-individual stability, and functional role of CpG methylation are reasonably well understood, little is known about DNA methylation targeting CpA, CpT, and CpC (non-CpG) dinucleotides. Here we report a comprehensive analysis of non-CpG methylation in 76 genome-scale DNA methylation maps across pluripotent and differentiated human cell types. We confirm non-CpG methylation to be predominantly present in pluripotent cell types and observe a decrease upon differentiation and near complete absence in various somatic cell types. Although no function has been assigned to it in pluripotency, our data highlight that non-CpG methylation patterns reappear upon iPS cell reprogramming. Intriguingly, the patterns are highly variable and show little conservation between different pluripotent cell lines. We find a strong correlation of non-CpG methylation and DNMT3 expression levels while showing statistical independence of non-CpG methylation from pluripotency associated gene expression. In line with these findings, we show that knockdown of DNMTA and DNMT3B in hESCs results in a global reduction of non-CpG methylation. Finally, non-CpG methylation appears to be spatially correlated with CpG methylation. In summary these results contribute further to our understanding of cytosine methylation patterns in human cells using a large representative sample set.
Conflict of interest statement
The authors have declared that no competing interests exist.
Figures
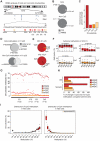
Figure 1. Global distribution of CpG and non-CpG methylation in human cell types.
(A) Schematic of RRBS data visualization and a selected 36 bp read. Blue lines indicate covered cytosines (CpN), black lines MspI restriction sites (middle). One selected RRBS read in this region is shown (bottom). Red circles indicate CpGs, light red boxes CpTs, dark red boxes CpAs and yellow boxes CpCs. Filled circles and boxes indicate dinucleotides with detectable levels of methylation. The percent below indicate the methylation levels by averaging the methylation state of a given cytosine over all reads that cover its position. (B) Venn diagrams show the theoretical RRBS coverage compared to the whole genome for CpGs (top) and non-CpGs (bottom) based on a 40–260 bp size selection. (C) Enrichment of cytosine dinucleotide frequency for RRBS relative to the whole genome. (D) Venn diagrams show the overlap of methylated CpGs (top) as well as methylated non-CpGs (bottom) exhibiting above threshold (≥10% and ≥5%) methylation in the whole methylome (WM) data by Lister et al. 2009 and our RRBS data for the same cell line and passage. Only those dinucleotides were considered that were covered in both data sets simultaneously by at least 5 reads. Numbers below the venn diagrams indicate overlap of both dinucleotide sets. (E) Pie chart of sequence context distribution of methylated cytosines in the human ESC line H1 (passage 25) and human fibroblasts 18 (passage 7). (F) Boxplots of the methylation levels as assessed by RRBS across six biological replicates of hESC line H1. Boxplots are based on all cytosine dinucleotides that show any evidence for methylation in H1 (median methylation ≥0.1% over all six replicates). Boxes are 25th and 75th quartiles, whiskers indicate most extreme data point less than 1.5 interquartile range from box and black bar represents the median. n indicates the number of dinucleotides covered in all and methylated in at least one of the six samples. (G) Distribution of methylated (≥10%) cytosine dinucleotides in human ES cells (ES, n = 30), iPS cells (n = 12), embryoid bodies (EB, n = 10) and 10 somatic cell types (n = 18). Percentages are methylated cytosine dinucleotides divided by corresponding total number of each cytosine dinucleotide with ≥5x coverage. (H) Barplot showing the average reduction in the number of methylated cytosine dinucleotides in EBs (n = 10) and somatic cells (n = 18) relative to pluripotent cells (n = 42). (I) Distribution of distinct CpG (left) and CpA (right) methylation levels for all CpA and CpG dinucleotides averaged over all hES samples (n = 30). The medians of the CpA methylation level distribution are fitted by the exponential distribution (yellow circle). Boxplots are defined as in (F).
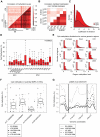
Figure 2. CpA methylation shows little conservation over several passages.
(A) Heatmap of pearson correlation coefficients for CpG (upper triangle) and CpA (lower triangle) methylation patterns in all pairs of pluripotent cell lines. Selected lines are highlighted. (B) Heatmap showing the pearson correlation coefficients for CpG (upper triangle) and CpA (lower triangle) methylation levels in pairs of pluripotent cell lines assessed at consecutive passages. (C) Distribution of the coefficient of variation over all individual CpG and CpA methylation levels across all ESC samples (n = 30). (D) Boxplot of CpA methylation levels in 7 ESC and 12 iPSC lines. Boxplots are based on 205623 CpAs that show more than 0.1% of median methylation in the selected ESC lines (n = 7). Boxes are 25th and 75th quartiles, whiskers indicate most extreme data point less than 1.5 interquartile range from box and black bar represents the median. (E) Distribution of CpA methylation levels in different genomic region classes averaged over a representative set of pluripotent cell lines at different passages (n = 12: H1, HUES1, HUES3, HUES6, HUES8, HUES45, H9, iPS 15b). HCPs are defined as promoters overlapping with a CG island, LCPs are promoters without a CG island. For a detailed definition of the regions see Materials and Methods. (F) Boxplot of CpA methylation levels across four genomic regions over all distinct ESC lines (n = 20) assessed by RRBS. These regions were reported to be consistently hypomethylated between five iPSC and two ESC lines . In addition methylation levels from previously published whole genome bisulfite sequencing (WM) for H1 , iPSC ADS as well as our HUES64 WM are shown. Boxes are 25th and 75th quartiles, whiskers indicate most extreme data point less than 1.5 interquartile range from box and black bar represents the median. (G) CpA methylation profile of one selected DMR (framed by black lines) on chromosome 22 based on a 1 kb tiling. The CpA methylation levels based on RRBS are shown for the median of all ESCs (n = 20) and all iPSCs (n = 12) as well as WM levels for H1p25, iPS ADS and HUES64.
Figure 3. CpA methylation dynamics are closely linked to DNMT3 gene expression levels.
(A) Number of CpAs (y-axis; value ×104) methylated (≥5% methylation) in various somatic cell types and median number of methylated CpAs in EBs. Median number of methylated CpAs in a representative subset of ESCs (n = 11) is shown as reference. Whiskers indicate 25th and 75th quartiles. (B) Distribution of CpA methylation levels in 7 pluripotent cell samples and matching 16 day EBs (top). Boxes are 25th and 75th quartiles, whiskers indicate most extreme data point less than 1.5 interquartile range from box and black bar represents the median. Below are normalized absolute log2 gene expression levels of DNMT3A, DNMT3B and OCT4 in the corresponding samples (measured using Affymetrix GeneChip HT HG-U133A microarrays; Table S1). Left sample in each pair corresponds to the undifferentiated state and right sample to the matching EB state. (C) Distribution of CpG methylation levels in 7 pluripotent cell lines and matching 16 day EBs. (D) CpA methylation levels of various genomic region classes in ESC line H1p38 and matching 16 EBs. (E) CpA methylation levels of various genomic region classes in iPSC line 27e matching day 16 EBs.
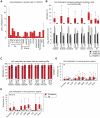
Figure 4. Knockdown of DNMT3A in hESCs causes global reduction of non-CpG methylation.
(A) OCT4 immunostaining of representative ES cell line HUES48 infected with a control shRNA and a shRNAs against DNMT3A. (B) Expression of various pluripotency associated genes in HUES48 infected with shRNAs against DNMT3A and controls as assessed by the Nanostring nCounter. (C) qRT-PCR of DNMT3A in HUES48 WT, HUES48 infected with shRNAs against DNMT3A and control shRNA against GFP. Expression values are normalized to β-Actin levels. (D) Percentage of methylated (≥10%) cytosine dinucleotides in HUES48 treated with shRNAs against DNMT3A and control samples. P-value was determined using Wilcoxon-rank test.
Figure 5. Genomic context and attributes of CpA methylation.
(A) Significant and most influential features predictive for CpA methylation in a linear model based on a 1 kb tiling of the human genome covered by RRBS (n = 32300 tiles). The linear model included classical sequence features (but excluding CpG density) as well as methylation of CpG, CpT, CpC, H3K36me3 methylation and conservation of CpA methylation state. F-statistics reported for 9 and 32291 degrees of freedom. (B) Feature importance for prediction of CpA methylation according to three machine learning approaches. Depicted are logistic regression and linear SVM weights (black and dark grey, respectively) as well as feature Mean Decrease in Gini Index (MDG, light grey) according to random forests (rescaled such that the largest MDG corresponds to 1). Significant features characterized by a p-value <0.05 for logistic regression or a z-score >1.96 for linear SVM are marked (***). A detailed description of features is given in Table S2. (C) Sequence context of consistently highly methylated (mean ≥15%) CpAs (n = 5551) over all ES cell lines n = 30.
Comment in
- Epigenetics: Dynamic DNA methylation.
Stower H. Stower H. Nat Rev Genet. 2012 Jan 4;13(2):75. doi: 10.1038/nrg3156. Nat Rev Genet. 2012. PMID: 22215132 No abstract available.
Similar articles
- De novo methylation of MMLV provirus in embryonic stem cells: CpG versus non-CpG methylation.
Dodge JE, Ramsahoye BH, Wo ZG, Okano M, Li E. Dodge JE, et al. Gene. 2002 May 1;289(1-2):41-8. doi: 10.1016/s0378-1119(02)00469-9. Gene. 2002. PMID: 12036582 - A panel of CpG methylation sites distinguishes human embryonic stem cells and induced pluripotent stem cells.
Huang K, Shen Y, Xue Z, Bibikova M, April C, Liu Z, Cheng L, Nagy A, Pellegrini M, Fan JB, Fan G. Huang K, et al. Stem Cell Reports. 2013 Dec 26;2(1):36-43. doi: 10.1016/j.stemcr.2013.11.003. eCollection 2014 Jan 14. Stem Cell Reports. 2013. PMID: 24511466 Free PMC article. - Genome-Scale Oscillations in DNA Methylation during Exit from Pluripotency.
Rulands S, Lee HJ, Clark SJ, Angermueller C, Smallwood SA, Krueger F, Mohammed H, Dean W, Nichols J, Rugg-Gunn P, Kelsey G, Stegle O, Simons BD, Reik W. Rulands S, et al. Cell Syst. 2018 Jul 25;7(1):63-76.e12. doi: 10.1016/j.cels.2018.06.012. Cell Syst. 2018. PMID: 30031774 Free PMC article. - Genetic Studies on Mammalian DNA Methyltransferases.
Dan J, Chen T. Dan J, et al. Adv Exp Med Biol. 2016;945:123-150. doi: 10.1007/978-3-319-43624-1_6. Adv Exp Med Biol. 2016. PMID: 27826837 Review. - The Roles of Human DNA Methyltransferases and Their Isoforms in Shaping the Epigenome.
Gujar H, Weisenberger DJ, Liang G. Gujar H, et al. Genes (Basel). 2019 Feb 23;10(2):172. doi: 10.3390/genes10020172. Genes (Basel). 2019. PMID: 30813436 Free PMC article. Review.
Cited by
- DNA Methylation: Shared and Divergent Features across Eukaryotes.
Schmitz RJ, Lewis ZA, Goll MG. Schmitz RJ, et al. Trends Genet. 2019 Nov;35(11):818-827. doi: 10.1016/j.tig.2019.07.007. Epub 2019 Aug 6. Trends Genet. 2019. PMID: 31399242 Free PMC article. Review. - DNA methylation and de-methylation using hybrid site-targeting proteins.
Lei Y, Huang YH, Goodell MA. Lei Y, et al. Genome Biol. 2018 Nov 6;19(1):187. doi: 10.1186/s13059-018-1566-2. Genome Biol. 2018. PMID: 30400938 Free PMC article. Review. - Folate Carrier Deficiency Drives Differential Methylation and Enhanced Cellular Potency in the Neural Plate Border.
Alata Jimenez N, Strobl-Mazzulla PH. Alata Jimenez N, et al. Front Cell Dev Biol. 2022 Jul 13;10:834625. doi: 10.3389/fcell.2022.834625. eCollection 2022. Front Cell Dev Biol. 2022. PMID: 35912103 Free PMC article. - The Impact of Alcohol-Induced Epigenetic Modifications in the Treatment of Alcohol use Disorders.
Fanfarillo F, Ferraguti G, Lucarelli M, Fuso A, Ceccanti M, Terracina S, Micangeli G, Tarani L, Fiore M. Fanfarillo F, et al. Curr Med Chem. 2024;31(36):5837-5855. doi: 10.2174/0109298673256937231004093143. Curr Med Chem. 2024. PMID: 37828672 Review. - Epigenetics and male reproduction: the consequences of paternal lifestyle on fertility, embryo development, and children lifetime health.
Stuppia L, Franzago M, Ballerini P, Gatta V, Antonucci I. Stuppia L, et al. Clin Epigenetics. 2015 Nov 11;7:120. doi: 10.1186/s13148-015-0155-4. eCollection 2015. Clin Epigenetics. 2015. PMID: 26566402 Free PMC article. Review.
References
- Goll MG, Bestor TH. Eukaryotic cytosine methyltransferases. Annu Rev Biochem. 2005;74:481–514. - PubMed
- Haines TR, Rodenhiser DI, Ainsworth PJ. Allele-specific non-CpG methylation of the Nf1 gene during early mouse development. Dev Biol. 2001;240:585–598. - PubMed
- Chan SW, Henderson IR, Jacobsen SE. Gardening the genome: DNA methylation in Arabidopsis thaliana. Nat Rev Genet. 2005;6:351–360. - PubMed
Publication types
MeSH terms
Substances
LinkOut - more resources
Full Text Sources
Other Literature Sources
Molecular Biology Databases


