Ultrastructural characterization of arterivirus replication structures: reshaping the endoplasmic reticulum to accommodate viral RNA synthesis - PubMed (original) (raw)
Ultrastructural characterization of arterivirus replication structures: reshaping the endoplasmic reticulum to accommodate viral RNA synthesis
Kèvin Knoops et al. J Virol. 2012 Mar.
Abstract
Virus-induced membrane structures support the assembly and function of positive-strand RNA virus replication complexes. The replicase proteins of arteriviruses are associated with double-membrane vesicles (DMVs), which were previously proposed to derive from the endoplasmic reticulum (ER). Using electron tomography, we performed an in-depth ultrastructural analysis of cells infected with the prototypic arterivirus equine arteritis virus (EAV). We established that the outer membranes of EAV-induced DMVs are interconnected with each other and with the ER, thus forming a reticulovesicular network (RVN) resembling that previously described for the distantly related severe acute respiratory syndrome (SARS) coronavirus. Despite significant morphological differences, a striking parallel between the two virus groups, and possibly all members of the order Nidovirales, is the accumulation in the DMV interior of double-stranded RNA, the presumed intermediate of viral RNA synthesis. In our electron tomograms, connections between the DMV interior and cytosol could not be unambiguously identified, suggesting that the double-stranded RNA is compartmentalized by the DMV membranes. As a novel approach to visualize and quantify the RNA content of viral replication structures, we explored electron spectroscopic imaging of DMVs, which revealed the presence of phosphorus in amounts equaling on average a few dozen copies of the EAV RNA genome. Finally, our electron tomograms revealed a network of nucleocapsid protein-containing protein tubules that appears to be intertwined with the RVN. This potential intermediate in nucleocapsid formation, which was not observed in coronavirus-infected cells, suggests that arterivirus RNA synthesis and assembly are coordinated in intracellular space.
Figures
Fig 1
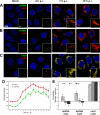
Immunofluorescence analysis of EAV-infected cells. EAV-infected Vero E6 cells were fixed at various time points after infection and processed for IF assays using rabbit antisera recognizing different replicase subunits and a mouse monoclonal antibody specific for dsRNA. Imaging was done using a confocal laser scanning microscope, and quantification of labeling intensity was carried out using wide-field fluorescence microscopy images. Scale bars, 10 μm and 2.5 μm (insets). (A to C) Time course dual-labeling IF assays for dsRNA/nsp3 (A), dsRNA/nsp9 (B), and nsp3/nsp9 (C). At 4 h p.i., the early signals for dsRNA and both nsps were found in close proximity to each other and partially overlapping. At later time points (shown here at 7 and 10 h p.i.), colocalization of dsRNA and either nsp was much less obvious, whereas the signals of nsp3 and nsp9 were still almost completely colocalized. (D) Graph showing the total pixel intensities from images acquired from EAV-infected cells that were fixed every hour between 0 and 15 h p.i. The nsp3 and dsRNA signals were quantified from 5 low-magnification images taken with a 40× objective, each containing about 75 cells. For both nsp3 and dsRNA, the intensity of the signals started to increase exponentially between 3 and 4 h p.i. and peaked at 9 h p.i. The error bars indicate standard deviations. (E) Graph showing the averaged Manders overlap coefficients for dsRNA, nsp3, and nsp9 at 4, 7, and 10 h p.i. (n = 25 cells per condition). By definition, Manders overlap coefficients range from 0 to 1, representing full separation and complete colocalization of signals, respectively. We interpreted values above 0.5 as indicative of a certain level of colocalization and values below 0.5 as indicative of a lack of colocalization.
Fig 2
Comparison of DMV morphology after different fixation procedures. EAV-infected Vero E6 cells were fixed at 7 h p.i. using different fixation methods to assess the most suitable preservation protocol for the EAV-induced membrane structures. The asterisks indicate the interiors of DMVs, and the insets are enlargements of the boxed areas, with white arrows pointing to the two bilayers of the DMVs. Scale bars, 100 nm. (A) Chemical fixation with 1.5% glutaraldehyde and, subsequently, 1% osmium tetroxide in 0.1 M sodium cacodylate buffer. The contrast of DMV membranes is relatively poor, and the double membranes are difficult to discern. The DMV interior shows an undefined appearance. (B) Cryofixation by plunge freezing, followed by FS. The lipid bilayers of DMVs are recognizable, and the DMV interior has a more granular appearance. As a result of ice crystal formation, the cytosol surrounding the DMV cluster contained electron-lucent areas. (C) Cryo-fixation by HPF, followed by FS. Overall, membrane contrast was high, and the cytosol was free of freezing artifacts. The interiors of DMVs prepared by HPF were visualized as electron-dense cores that were surrounded by electron-lucent halos.
Fig 3
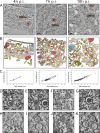
Electron tomography of cytoplasmic areas containing EAV-induced DMVs. (A) EAV-infected Vero E6 cells were high-pressure frozen at 4, 7, and 10 h p.i. and processed for dual-axis electron tomography to obtain 3-D reconstructions of relevant cytoplasmic areas. The images show a 10-nm slice through the tomographic reconstruction of 200-nm-thick resin-embedded sections. Along with DMVs (brown), cores (blue), ER (beige), EAV tubules (green), mitochondria (M; red), smooth-walled vesicles (V; yellow), multivesicular body (MVB; blue-gray), and actin filaments (A; purple) are depicted. Scale bars, 500 nm. (B) 3-D surface-rendered models of the tomograms that were derived from panel A. The models illustrate the relative abundances of DMVs at different time points, the clustering of DMVs, and the cytoplasmic content near the vesicles. The same coloring scheme as in panel A was used to show the different organelles. (C) All DMVs within the tomograms, acquired at 4 (n = 34), 7 (n = 193), and 10 h p.i. (n = 194) and shown in panel B, were delimited in silico, counted, and measured in the x and y directions to derive average diameters of the complete DMV and the DMV core. If the equator of an individual DMV was present within the tomogram volume, a subvolume of 250 (x) by 250 (y) by 10 (z) pixels was extracted from the central part of the DMV and merged into a single image representing a 12-nm-thick section through the middle of the DMV. The graph shows the correlation between the average (x, y) diameter of individual DMVs (x axis) and the corresponding average (x, y) diameter of the DMV cores (y axis). (D to G) Close-ups of the tomograms shown in panel A. The arrows indicate connections of DMV outer membranes with the ER (D), other DMVs (E), and curved double-membrane structures (F). Ribosomes were found to decorate the surface of the outer DMV membrane (G, arrows). (H to K) Close-ups of structures comparable to those in panels D to G but derived from plunge frozen samples exhibiting alternative staining and contrast of membrane structures. Scale bars, 50 nm.
Fig 4
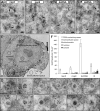
Immunogold labeling of EAV replicase and dsRNA in infected cells. EAV-infected Vero E6 cells (7 h p.i.) were high-pressure frozen and processed for FS and IEM (see Materials and Methods). In all labelings, 10-nm colloidal gold particles conjugated to protein A were used for detection of the primary antibodies. Scale bars, 100 nm. (A and B) Immunolabeling with antisera recognizing different EAV nsp3 (transmembrane protein) and nsp9 (the EAV RdRp) proteins. Label was predominantly found on DMV membranes and their surroundings. (C and D) Immunolabeling for dsRNA, showing extensive clustering of label on DMV cores (black arrows). Some clusters of label seemed to be localized outside DMVs (white arrows); however, electron tomography combined with serial sectioning indicated the presence of obscured DMV “caps” as a result of sectioning. (E) Example of a low-magnification mosaic image of a whole cell (from a section immunolabeled for dsRNA) and the marking of the five different compartments that were used for a quantitative analysis of the immunolabeling. Scale bar, 2.5 μm. (F) The specific association with RVN-containing areas in EAV-infected cells (at 7 h p.i.), or lack thereof, was verified for the immunogold-labeling experiments using antibodies recognizing nsp3, nsp9, dsRNA, and N protein (Fig. 5B). For each labeling, the gold beads inside different cellular compartments (n = 3) (see panel E and main text) were counted, and means and standard deviations are shown. (G) Gallery of close-ups of EAV-induced DMVs highlighting the highly specific association of the labeling for dsRNA with the DMV core structure.
Fig 5
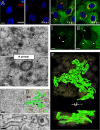
Nucleocapsid protein-containing structures are intertwined with EAV-induced replication structures. (A) EAV-infected Vero E6 cells were fixed at various time points after infection, processed for IF microscopy using dual labeling for nsp3 and N protein, and analyzed by confocal laser scanning microscopy. By 4 h p.i., nsp3 signal was visible in most of the infected cells, but N protein was not yet detectable. Although the intensity varied between cells, N protein signal became detectable in most cells by 7 h p.i. and partially overlapped with nsp3 signal (close-ups I and II, white arrows). By 10 h p.i., N protein had become distributed throughout the cytoplasm of infected cells. Scale bars, 10 μm (A) and 5 μm (close-ups). (B) EAV-infected Vero E6 cells were high-pressure frozen at 8 h p.i., processed for FS, and immunogold labeled for the N protein. The majority of the label was found to be associated with EAV-induced tubular structures (black arrows) and DMVs (white arrows). Scale bars, 100 nm. (C) EAV-infected Vero E6 cells were high-pressure frozen at 8 h p.i. and processed for dual-axis electron tomography (see also Fig. 3). This 5-nm-thick slice illustrates the relatively high electron density of the EAV-induced tubules. Scale bar, 100 nm. (D) Three-dimensional ET reconstruction illustrating the local openings in tubules (N, depicted in green) and proximity of DMVs (depicted in brown, with cores in blue) and the ER (beige). (E) Close-up of panel C (boxed area) illustrating the morphological difference between the dense single layer constituting the tubules (white arrows) and the double bilayer of DMV membranes (black arrows). The arrows indicate areas where the tubules or membranes run in parallel with the electron beam and thus contain the maximum resolution in x and y. Scale bar, 50 nm. (F) 3-D ET reconstruction illustrating the distribution and architecture of the EAV tubules (depicted in green) and their proximity to the DMVs (depicted in brown, with cores in blue and the ER in beige).
Fig 6
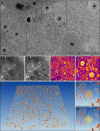
Visualization of RNA inside EAV-induced DMVs by electron spectroscopy imaging-based phosphorus mapping. EAV-infected cells (8 h p.i.) were high-pressure frozen, freeze substituted, and cut into 60-nm-thick sections. Scale bar, 100 nm. (A) 200-kV zero-loss image showing part of the EAV-infected cytoplasm containing DMV cores (asterisks) and mitochondria (M). (B and C) Phosphorus elemental maps were obtained by acquisition of pre-edge (B) and post-edge (C) images at 120- and 157-eV electron loss, respectively, with a 15-eV slit width. (D and E) Phosphorus maps were derived from the boxed areas in panel A by calculating the ratio between the pre- and post-edge intensities, which clearly revealed the P contents of DMV cores (asterisks), ribosomes (circled), and EAV N protein-containing tubules (arrows). (F) An ESI tomogram was recorded at the P energy edge, and direct volume rendering was used to visualize the P content in 3-D. The boxed area is enlarged in panels G and H. (G) Besides the abundant ribosomes (circled), the cores of EAV-induced DMVs were clearly visible. (H) DMV core highlighted with an isosurface that was created by thresholding using a gray value that revealed isolated ribosomes. The resulting isosurface suggests a thread-like ultrastructure of the RNA content inside.
Similar articles
- Biogenesis and architecture of arterivirus replication organelles.
van der Hoeven B, Oudshoorn D, Koster AJ, Snijder EJ, Kikkert M, Bárcena M. van der Hoeven B, et al. Virus Res. 2016 Jul 15;220:70-90. doi: 10.1016/j.virusres.2016.04.001. Epub 2016 Apr 9. Virus Res. 2016. PMID: 27071852 Free PMC article. Review. - SARS-coronavirus replication is supported by a reticulovesicular network of modified endoplasmic reticulum.
Knoops K, Kikkert M, Worm SH, Zevenhoven-Dobbe JC, van der Meer Y, Koster AJ, Mommaas AM, Snijder EJ. Knoops K, et al. PLoS Biol. 2008 Sep 16;6(9):e226. doi: 10.1371/journal.pbio.0060226. PLoS Biol. 2008. PMID: 18798692 Free PMC article. - Open reading frame 1a-encoded subunits of the arterivirus replicase induce endoplasmic reticulum-derived double-membrane vesicles which carry the viral replication complex.
Pedersen KW, van der Meer Y, Roos N, Snijder EJ. Pedersen KW, et al. J Virol. 1999 Mar;73(3):2016-26. doi: 10.1128/JVI.73.3.2016-2026.1999. J Virol. 1999. PMID: 9971782 Free PMC article. - An autophagy-independent role for LC3 in equine arteritis virus replication.
Monastyrska I, Ulasli M, Rottier PJ, Guan JL, Reggiori F, de Haan CA. Monastyrska I, et al. Autophagy. 2013 Feb 1;9(2):164-74. doi: 10.4161/auto.22743. Epub 2012 Nov 26. Autophagy. 2013. PMID: 23182945 Free PMC article. - The double-membrane vesicle (DMV): a virus-induced organelle dedicated to the replication of SARS-CoV-2 and other positive-sense single-stranded RNA viruses.
Roingeard P, Eymieux S, Burlaud-Gaillard J, Hourioux C, Patient R, Blanchard E. Roingeard P, et al. Cell Mol Life Sci. 2022 Jul 16;79(8):425. doi: 10.1007/s00018-022-04469-x. Cell Mol Life Sci. 2022. PMID: 35841484 Free PMC article. Review.
Cited by
- Transcriptional kinetics of NADC34-like porcine reproductive and respiratory syndrome virus during cellular infection.
Zhang R, Li H, Xie H, Wang P, Yu C, Li J, Yang Z, Zeshan B, Cao A, Wang X. Zhang R, et al. Arch Virol. 2024 Aug 24;169(9):186. doi: 10.1007/s00705-024-06113-4. Arch Virol. 2024. PMID: 39180681 - Mechanism, structural and functional insights into nidovirus-induced double-membrane vesicles.
Wang X, Chen Y, Qi C, Li F, Zhang Y, Zhou J, Wu H, Zhang T, Qi A, Ouyang H, Xie Z, Pang D. Wang X, et al. Front Immunol. 2024 Jun 11;15:1340332. doi: 10.3389/fimmu.2024.1340332. eCollection 2024. Front Immunol. 2024. PMID: 38919631 Free PMC article. Review. - GTPase activity of porcine Mx1 plays a dominant role in inhibiting the N-Nsp9 interaction and thus inhibiting PRRSV replication.
Hu Y, Wu X, Tian Y, Jiang D, Ren J, Li Z, Ding X, Zhang Q, Yoo D, Miller LC, Lee C, Cong X, Li J, Du Y, Qi J. Hu Y, et al. J Virol. 2024 Apr 16;98(4):e0184423. doi: 10.1128/jvi.01844-23. Epub 2024 Mar 4. J Virol. 2024. PMID: 38436247 Free PMC article. - Endomembrane remodeling in SARS-CoV-2 infection.
Chen D, Zhao YG, Zhang H. Chen D, et al. Cell Insight. 2022 May 17;1(3):100031. doi: 10.1016/j.cellin.2022.100031. eCollection 2022 Jun. Cell Insight. 2022. PMID: 37193051 Free PMC article. Review. - Evasion strategies of porcine reproductive and respiratory syndrome virus.
Chen XX, Qiao S, Li R, Wang J, Li X, Zhang G. Chen XX, et al. Front Microbiol. 2023 Mar 17;14:1140449. doi: 10.3389/fmicb.2023.1140449. eCollection 2023. Front Microbiol. 2023. PMID: 37007469 Free PMC article. Review.
References
- Ahmed K, Li R, Bazett-Jones DP. 2009. Electron spectroscopic imaging of the nuclear landscape. Methods Mol. Biol. 464:415–423 - PubMed
- Belin S, et al. 2010. Purification of ribosomes from human cell lines. Curr. Protoc. Cell Biol. Chapter 3:Unit 3.40 - PubMed
- Bienz K, Egger D, Pasamontes L. 1987. Association of polioviral proteins of the P2 genomic region with the viral replication complex and virus-induced membrane synthesis as visualized by electron microscopic immunocytochemistry and autoradiography. Virology 160:220–226 - PubMed
Publication types
MeSH terms
Substances
LinkOut - more resources
Full Text Sources
Other Literature Sources
Research Materials
Miscellaneous
