High-resolution view of the yeast meiotic program revealed by ribosome profiling - PubMed (original) (raw)
High-resolution view of the yeast meiotic program revealed by ribosome profiling
Gloria A Brar et al. Science. 2012.
Abstract
Meiosis is a complex developmental process that generates haploid cells from diploid progenitors. We measured messenger RNA (mRNA) abundance and protein production through the yeast meiotic sporulation program and found strong, stage-specific expression for most genes, achieved through control of both mRNA levels and translational efficiency. Monitoring of protein production timing revealed uncharacterized recombination factors and extensive organellar remodeling. Meiotic translation is also shifted toward noncanonical sites, including short open reading frames (ORFs) on unannnotated transcripts and upstream regions of known transcripts (uORFs). Ribosome occupancy at near-cognate uORFs was associated with more efficient ORF translation; by contrast, some AUG uORFs, often exposed by regulated 5' leader extensions, acted competitively. This work reveals pervasive translational control in meiosis and helps to illuminate the molecular basis of the broad restructuring of meiotic cells.
Figures
Fig. 1
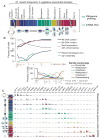
Ribosome profiling through meiosis. (A) Time points (white lines) were taken through two overlapping time courses. Cartoon representations of meiotic stages are below. (B) A subset of staging controls. Positions of staging plots correspond to time points in (A). (C) Ribosome footprints across specific genes are shown for categories in fig. S4. Scales on the y axis are independent by gene.
Fig. 2
A global view of protein synthesis through sporulation. (A) Ribosome footprints (RPKMs) were summed over each yeast gene (columns) for all samples except steady-state spores (rows). The summed expression of each gene over time points was normalized for the time course, and genes were subjected to clustering. Several clusters are noted by lines below the chart: 1, Mitochondrial ribosome; 2, nutrient uptake and/or amino acid biosynthesis; 3, mitochondrial function; 4, proteasome; 5, redox and energy generation; and 6, ribosome and translation machinery. Meiotic progression is indicated pictorially to the right. (Top) A cluster containing genes responsible for DNA replication, with the gene identities to the right. To the left is the average footprint density across the cluster, with time points corresponding to bulk DNA replication represented by arrows. (Bottom) A cluster of genes associated with recombination and SC formation. The bar to the left shows the timing of these events as determined by staging controls. Single asterisks identify genes analyzed in (B) and (C) and fig. S7. Double asterisks indicate that both MND1 and the overlapping ORF, YGL182C, were identified in this cluster. (B) Wild-type, _ydr506c_Δ, and _ydr506c spo11_Δ cells were induced to sporulate. At indicated times, samples were scored for nuclear division. (C) Wild-type, _ylr445w_Δ, and _ylr445w_Δ _spo11_Δ cells were induced to sporulate and were treated as in (B).
Fig. 3
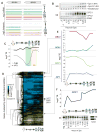
Widespread dynamic translational control in meiosis. (A) Log2 mRNA and footprints (RPKM) for a region containing SPS1 and SPS2 over pooled time points (fig. S4). (B) SPS1-3HA and SPS2-FLAG cells carrying an estrogen-inducible NDT80 allele were induced to sporulate. At 6 hours, β-estradiol was added. Samples from indicated times were subjected to Western blotting (WB) and Northern blotting (NB). (C) Log2 TE values for CLB3 and YPT1 for pooled time points (fig. S4). MI and MII are indicated by colored shading as boxes. (D) Cluster analysis of log2 TE through meiosis for pooled categories (fig. S4) for all genes. (E) Log2 TEs are plotted as in (C) for AMA1, RCR1, ORC1, and ZIP1. (F) Log2 TEs are plotted as in (C) for HAC1. Below, total RNA from the original time course (see fig. S1) was subjected to Northern blotting for HAC1.
Fig. 4
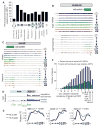
Noncanonical translation is pervasive in meiotic cells. (A) Footprints from pooled time points (see fig. S4) were mapped. The percentage of these footprints outside of known ORF annotations is plotted. (B) mRNA and ribosome occupancy profiles around YOL092W, with sense above the line for each time point and antisense below. Single asterisk denotes the sORF start site. The “AUG unit” (sORF) was annotated by the strategy shown in fig. S11. (C) The region around SAS4 is displayed as in (B), with truncated ORF start denoted by a single asterisk. (D) Ribosome occupancy profile for vegetative cells in exponential growth phase and meiotic cells over the leader of ACB1. (E) For pooled time points (see fig. S4), TEs are plotted for ORFs and for leaders (see SOM for a discussion of leader TE determination) for IME1, CDC28, and PDS1. Values are normalized to the same range for both plots. (F) Correlation coefficients [determined from plots as in (E)] were determined for each gene with uORFs for leaders with only near-cognate uORFs and at least one AUG uORF. The positions of six genes that support cap-independent translation (39) are noted.
Fig. 5
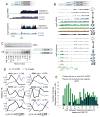
Regulated transcript extensions expose novel regulatory uORFs. (A) mRNA and ribosome occupancy profiles around SUP35. (B) ORC1 region displayed as in (A). (C) Total RNA from the original time course (see fig. S1) was subjected to Northern blotting for ORC1. (D) Analysis as in Fig. 4E for ORC1, SUP35, NDJ1, RED1, NDC80, and POP4. (E) Analysis as in Fig. 4F for genes with regulated leader extension (table S5).
Similar articles
- Genome-wide analysis in vivo of translation with nucleotide resolution using ribosome profiling.
Ingolia NT, Ghaemmaghami S, Newman JR, Weissman JS. Ingolia NT, et al. Science. 2009 Apr 10;324(5924):218-23. doi: 10.1126/science.1168978. Epub 2009 Feb 12. Science. 2009. PMID: 19213877 Free PMC article. - A helicase links upstream ORFs and RNA structure.
Jankowsky E, Guenther UP. Jankowsky E, et al. Curr Genet. 2019 Apr;65(2):453-456. doi: 10.1007/s00294-018-0911-z. Epub 2018 Nov 27. Curr Genet. 2019. PMID: 30483885 Free PMC article. Review. - Sequestration of mRNAs Modulates the Timing of Translation during Meiosis in Budding Yeast.
Jin L, Zhang K, Xu Y, Sternglanz R, Neiman AM. Jin L, et al. Mol Cell Biol. 2015 Oct;35(20):3448-58. doi: 10.1128/MCB.00189-15. Epub 2015 Jul 27. Mol Cell Biol. 2015. PMID: 26217015 Free PMC article. - SSP1, a gene necessary for proper completion of meiotic divisions and spore formation in Saccharomyces cerevisiae.
Nag DK, Koonce MP, Axelrod J. Nag DK, et al. Mol Cell Biol. 1997 Dec;17(12):7029-39. doi: 10.1128/MCB.17.12.7029. Mol Cell Biol. 1997. PMID: 9372934 Free PMC article. - Post-transcriptional regulation in budding yeast meiosis.
Jin L, Neiman AM. Jin L, et al. Curr Genet. 2016 May;62(2):313-5. doi: 10.1007/s00294-015-0546-2. Epub 2015 Nov 27. Curr Genet. 2016. PMID: 26613728 Free PMC article. Review.
Cited by
- Synchronized mitochondrial and cytosolic translation programs.
Couvillion MT, Soto IC, Shipkovenska G, Churchman LS. Couvillion MT, et al. Nature. 2016 May 26;533(7604):499-503. doi: 10.1038/nature18015. Epub 2016 May 11. Nature. 2016. PMID: 27225121 Free PMC article. - Proto-genes and de novo gene birth.
Carvunis AR, Rolland T, Wapinski I, Calderwood MA, Yildirim MA, Simonis N, Charloteaux B, Hidalgo CA, Barbette J, Santhanam B, Brar GA, Weissman JS, Regev A, Thierry-Mieg N, Cusick ME, Vidal M. Carvunis AR, et al. Nature. 2012 Jul 19;487(7407):370-4. doi: 10.1038/nature11184. Nature. 2012. PMID: 22722833 Free PMC article. - Observation of dually decoded regions of the human genome using ribosome profiling data.
Michel AM, Choudhury KR, Firth AE, Ingolia NT, Atkins JF, Baranov PV. Michel AM, et al. Genome Res. 2012 Nov;22(11):2219-29. doi: 10.1101/gr.133249.111. Epub 2012 May 16. Genome Res. 2012. PMID: 22593554 Free PMC article. - Dynamics of Translation of Single mRNA Molecules In Vivo.
Yan X, Hoek TA, Vale RD, Tanenbaum ME. Yan X, et al. Cell. 2016 May 5;165(4):976-89. doi: 10.1016/j.cell.2016.04.034. Cell. 2016. PMID: 27153498 Free PMC article. - Widespread Co-translational RNA Decay Reveals Ribosome Dynamics.
Pelechano V, Wei W, Steinmetz LM. Pelechano V, et al. Cell. 2015 Jun 4;161(6):1400-12. doi: 10.1016/j.cell.2015.05.008. Cell. 2015. PMID: 26046441 Free PMC article.
References
Publication types
MeSH terms
Substances
Grants and funding
- F32 GM080853/GM/NIGMS NIH HHS/United States
- P01 AG010770/AG/NIA NIH HHS/United States
- HHMI/Howard Hughes Medical Institute/United States
- GM080853/GM/NIGMS NIH HHS/United States
- AG10770/AG/NIA NIH HHS/United States
LinkOut - more resources
Full Text Sources
Other Literature Sources
Molecular Biology Databases


