Expression profiling of synaptic microRNAs from the adult rat brain identifies regional differences and seizure-induced dynamic modulation - PubMed (original) (raw)
Expression profiling of synaptic microRNAs from the adult rat brain identifies regional differences and seizure-induced dynamic modulation
Israel Pichardo-Casas et al. Brain Res. 2012.
Abstract
In recent years, microRNAs or miRNAs have been proposed to target neuronal mRNAs localized near the synapse, exerting a pivotal role in modulating local protein synthesis, and presumably affecting adaptive mechanisms such as synaptic plasticity. In the present study we have characterized the distribution of miRNAs in five regions of the adult mammalian brain and compared the relative abundance between total fractions and purified synaptoneurosomes (SN), using three different methodologies. The results show selective enrichment or depletion of some miRNAs when comparing total versus SN fractions. These miRNAs were different for each brain region explored. Changes in distribution could not be attributed to simple diffusion or to a targeting sequence inside the miRNAs. In silico analysis suggest that the differences in distribution may be related to the preferential concentration of synaptically localized mRNA targeted by the miRNAs. These results favor a model of co-transport of the miRNA-mRNA complex to the synapse, although further studies are required to validate this hypothesis. Using an in vivo model for increasing excitatory activity in the cortex and the hippocampus indicates that the distribution of some miRNAs can be modulated by enhanced neuronal (epileptogenic) activity. All these results demonstrate the dynamic modulation in the local distribution of miRNAs from the adult brain, which may play key roles in controlling localized protein synthesis at the synapse.
Copyright © 2011 Elsevier B.V. All rights reserved.
Figures
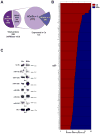
Figure 1. Expression analysis of synaptoneurosomal microRNAs from the whole brain of the adult rat
(A) Pie diagram illustrating the 141 microRNAs found in the adult rat brain from the 258 explored (miRBase v9.0). (B) Percentage Ce/SCe miRNAs expression for the 141 found in the rat brain. (C) Identification of some of the most abundant matures miRNAs by Northern Blot (NB). Numbers shown below illustrate the ratio Ce/SCe from densitometry analysis. The non-coding RNA BC1 is used as control.
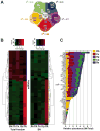
Figure 2. Differential expression patterns of synaptoneurosomal microRNAs derived from five neuroanatomical regions of the brain
(A) Pie diagram illustrating the exclusively expressed and shared microRNAs in the five different areas of the brain explored. Areas are: Olfactory bulb (Ob), Cerebellum (Cb), Hippocampus (Hp), Cortex (Cx) and Brain stem (Bs). In all cases the capital S before the names indicate the respective synaptoneurosomal fraction. The Pearson's coefficients (R2) for the number of miRNAs expressed by fraction are indicated for each brain region. (B) Heatmap plotting of the 49 microRNAs selected by MAANOVA (_P_≤0.1) 54 miRNAs with consistent expression across all samples from the different regions explored in the rat brain. MiRNAs were hierarchically clustered and plotted as a heatmap. (C) Plotting of the same miRNAs by relative abundance (SN/Total) separated by areas of the brain. Notice that some miRNAs are selective for the olfactory bulb (Ob, in yellow) such as miR-211 and 200c, while others are exclusive for the cerebellum (Cb, in green) such as miR-378 and 206.
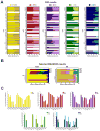
Figure 3. Relative expression and differential processing of miRNAs derived from distinct areas of the brain and their synaptoneurosomal fractions
(A) Normalized expression of total homogenate SN fraction of 62 miRNAs (3SD results) arbitrarily selected by relevance with previously published data for comparison purposes. Data was computed taking as 100% the total sum of normalized fluorescence intensity mean for SN and total. (B) Normalized expression of miRNAs selected by MAANOVA analysis. Length of the bar is calibrated to 100% after summation of miRNA expression values observed by tissue sample. These miRNAs showed consistent expression across all tissues analyzed, for both SN and total fractions. (C) Differential processing of leader and star strands of miRNAs whose precursor gives rise to stable mature sequences (∼21nt), which have different abundances according to the tissue of origin. Bars represent the ratio leader/star of signal intensity observed in the microarray data in both fractions. All values were expressed in Log10 scale.
Figure 4. KA treatment modifies the synaptoneurosomal expression of cortical and hippocampal miRNAs in vivo
(A) Schematized protocol of KA treatment used for seizure induction. Cortical (Cx) and hippocampal (Hp) miRNA expression was assessed by qPCR on either (panels B-E) the total homogenate, or (panels C-F) the SN fractions. As input, 200 ng of total RNA from three animals from each group was used as template for reverse transcription. The SN/Total ratio of miRNA expression in Cx (D) and Hp (G) reflect variable abundances of the measured miRNAs. Significant differences were calculated by a two-tailed Student's t-test analysis for paired samples (asterisks; _P_≤0.01).
Similar articles
- Selective distribution and dynamic modulation of miRNAs in the synapse and its possible role in Alzheimer's Disease.
Garza-Manero S, Pichardo-Casas I, Arias C, Vaca L, Zepeda A. Garza-Manero S, et al. Brain Res. 2014 Oct 10;1584:80-93. doi: 10.1016/j.brainres.2013.12.009. Epub 2013 Dec 16. Brain Res. 2014. PMID: 24355599 Review. - MicroRNA regulation of the synaptic plasticity-related gene Arc.
Wibrand K, Pai B, Siripornmongcolchai T, Bittins M, Berentsen B, Ofte ML, Weigel A, Skaftnesmo KO, Bramham CR. Wibrand K, et al. PLoS One. 2012;7(7):e41688. doi: 10.1371/journal.pone.0041688. Epub 2012 Jul 26. PLoS One. 2012. PMID: 22844515 Free PMC article. - Synaptic microRNAs Coordinately Regulate Synaptic mRNAs: Perturbation by Chronic Alcohol Consumption.
Most D, Leiter C, Blednov YA, Harris RA, Mayfield RD. Most D, et al. Neuropsychopharmacology. 2016 Jan;41(2):538-48. doi: 10.1038/npp.2015.179. Epub 2015 Jun 24. Neuropsychopharmacology. 2016. PMID: 26105134 Free PMC article. - Antagonizing Increased miR-135a Levels at the Chronic Stage of Experimental TLE Reduces Spontaneous Recurrent Seizures.
Vangoor VR, Reschke CR, Senthilkumar K, van de Haar LL, de Wit M, Giuliani G, Broekhoven MH, Morris G, Engel T, Brennan GP, Conroy RM, van Rijen PC, Gosselaar PH, Schorge S, Schaapveld RQJ, Henshall DC, De Graan PNE, Pasterkamp RJ. Vangoor VR, et al. J Neurosci. 2019 Jun 26;39(26):5064-5079. doi: 10.1523/JNEUROSCI.3014-18.2019. Epub 2019 Apr 23. J Neurosci. 2019. PMID: 31015341 Free PMC article. - miRNAs in synapse development and synaptic plasticity.
Hu Z, Li Z. Hu Z, et al. Curr Opin Neurobiol. 2017 Aug;45:24-31. doi: 10.1016/j.conb.2017.02.014. Epub 2017 Mar 21. Curr Opin Neurobiol. 2017. PMID: 28334640 Free PMC article. Review.
Cited by
- Molecular basis of alcoholism.
Most D, Ferguson L, Harris RA. Most D, et al. Handb Clin Neurol. 2014;125:89-111. doi: 10.1016/B978-0-444-62619-6.00006-9. Handb Clin Neurol. 2014. PMID: 25307570 Free PMC article. Review. - Synaptic vesicles contain small ribonucleic acids (sRNAs) including transfer RNA fragments (trfRNA) and microRNAs (miRNA).
Li H, Wu C, Aramayo R, Sachs MS, Harlow ML. Li H, et al. Sci Rep. 2015 Oct 8;5:14918. doi: 10.1038/srep14918. Sci Rep. 2015. PMID: 26446566 Free PMC article. - MiR-218 targets MeCP2 and inhibits heroin seeking behavior.
Yan B, Hu Z, Yao W, Le Q, Xu B, Liu X, Ma L. Yan B, et al. Sci Rep. 2017 Jan 11;7:40413. doi: 10.1038/srep40413. Sci Rep. 2017. PMID: 28074855 Free PMC article. - miR-23a-3p and miR-181a-5p modulate SNAP-25 expression.
Agostini S, Bolognesi E, Mancuso R, Marventano I, Citterio LA, Guerini FR, Clerici M. Agostini S, et al. PLoS One. 2023 Jan 17;18(1):e0279961. doi: 10.1371/journal.pone.0279961. eCollection 2023. PLoS One. 2023. PMID: 36649268 Free PMC article. - Potential Role of miRNAs as Theranostic Biomarkers of Epilepsy.
Cava C, Manna I, Gambardella A, Bertoli G, Castiglioni I. Cava C, et al. Mol Ther Nucleic Acids. 2018 Dec 7;13:275-290. doi: 10.1016/j.omtn.2018.09.008. Epub 2018 Sep 13. Mol Ther Nucleic Acids. 2018. PMID: 30321815 Free PMC article. Review.
References
- Al-Shahrour F, Diaz-Uriarte R, Dopazo J. FatiGO: a web tool for finding significant associations of Gene Ontology terms with groups of genes. Bioinformatics. 2004;20:578–80. - PubMed
- Altman NS, Hua J. Extending the loop design for two-channel microarray experiments. Genet Res. 2006;88:153–63. - PubMed
- Ashraf SI, McLoon AL, Sclarsic SM, Kunes S. Synaptic protein synthesis associated with memory is regulated by the RISC pathway in Drosophila. Cell. 2006;124:191–205. - PubMed
- Banerjee S, Neveu P, Kosik KS. A coordinated local translational control point at the synapse involving relief from silencing and MOV10 degradation. Neuron. 2009;64:871–84. - PubMed
MeSH terms
Substances
LinkOut - more resources
Full Text Sources
Other Literature Sources
Medical


