Remodeling of the arcuate nucleus energy-balance circuit is inhibited in obese mice - PubMed (original) (raw)
. 2012 Jan;122(1):142-52.
doi: 10.1172/JCI43134. Epub 2011 Dec 27.
Affiliations
- PMID: 22201680
- PMCID: PMC3248278
- DOI: 10.1172/JCI43134
Remodeling of the arcuate nucleus energy-balance circuit is inhibited in obese mice
David E G McNay et al. J Clin Invest. 2012 Jan.
Abstract
In the CNS, the hypothalamic arcuate nucleus (ARN) energy-balance circuit plays a key role in regulating body weight. Recent studies have shown that neurogenesis occurs in the adult hypothalamus, revealing that the ARN energy-balance circuit is more plastic than originally believed. Changes in diet result in altered gene expression and neuronal activity in the ARN, some of which may reflect hypothalamic plasticity. To explore this possibility, we examined the turnover of hypothalamic neurons in mice with obesity secondary to either high-fat diet (HFD) consumption or leptin deficiency. We found substantial turnover of neurons in the ARN that resulted in ongoing cellular remodeling. Feeding mice HFD suppressed neurogenesis, as demonstrated by the observation that these mice both generated fewer new neurons and retained more old neurons. This suppression of neuronal turnover was associated with increased apoptosis of newborn neurons. Leptin-deficient mice also generated fewer new neurons, an observation that was explained in part by a loss of hypothalamic neural stem cells. These data demonstrate that there is substantial postnatal turnover of the arcuate neuronal circuitry in the mouse and reveal the unexpected capacity of diet and leptin deficiency to inhibit this neuronal remodeling. This insight has important implications for our understanding of nutritional regulation of energy balance and brain function.
Figures
Figure 1. BrdU administration at E10.5 labels embryo-born neurons in the adult hypothalamus.
(A) Coronal sections of ARN at E10.5, showing proliferative neural stem cells (labeled with BrdU [red]) within the hypothalamic neuroepithelium giving rise to energy-balance neurons (POMC+ [green] counterstained with DAPI [blue]). (B) By 4 weeks of age, all strongly BrdU-labeled (red) cells within the parenchyma (white arrowheads) had differentiated into neurons (NeuN+HuC/D+ [green] counterstained with DAPI [blue]). The inset shows a high-magnification view of a labeled ARN neuron. Rare ependymal glia retain strong BrdU label (asterisk) and may represent adult neural stem cells. Scale bar: 50 μm. Original magnification, ×2 (inset).
Figure 2. ARN energy-balance neurons are turned over by ongoing neurogenesis.
(A–C) Nuclei labeled with BrdU (red) at E10.5 remaining in the ARN at 4, 12, and 26 weeks, counterstained with DAPI (blue). (D) Quantification of ARN neuron survival, showing that labeled ARN neurons were lost between 4 and 12 weeks of age but not between 12 and 26 weeks of age. (E–G) POMC neurons (green) labeled with BrdU (red) at E10.5 remaining in the ARN at 4, 12, and 26 weeks. (H) Quantification of POMC neuron survival, showing that labeled POMC neurons were lost between 4 and 12 weeks of age but not between 12 and 26 weeks of age. (I–K) NPY neurons (green) labeled with BrdU (red) at E10.5 remaining in the ARN at 4, 12, and 26 weeks. We made use of NPY-hrGFP mice to reveal NPY neurons. (L) Quantification of NPY neuron survival, showing that labeled NPY neurons were lost between 4 and 12 weeks of age but not between 12 and 26 weeks of age. (M–O) Nuclei labeled with BrdU (red) at E10.5 remaining in the amygdala at 4, 12, and 26 weeks, counterstained with DAPI (blue). (P) Quantification of amygdala neuron survival, showing that labeled amygdala neurons were not lost between 4 and 12 weeks of age or between 12 and 26 weeks of age. (Columns indicate total cell counts as a percentage of cell count at 4 weeks.) *P < 0.05 compared with 4 weeks; #P < 0.05 compared with 12 weeks. (Q) Schematic of analysis. Mean ± SEM; n = 10–19 at 4 weeks, 7–11 at 12 weeks, 4–9 at 26 weeks. Scale bar: 100 μm.
Figure 3. DIO inhibits adult hypothalamic neurogenesis.
Sixteen-week-old mice were i.c.v. infused with BrdU for 7 days and harvested 4 weeks later. (A–C) The number of newborn (BrdU-labeled) cells, including neurons, was significantly reduced in the hypothalamus of DIO mice compared with that in lean controls. (D) However, there was no difference in the percentage of cells adopting a neuronal fate between the 2 groups, as indicated by an equal proportion of BrdU-labeled cells adopting a HuC/D+ fate. Scale bar: 100 μm. Data are mean ± SEM. n = 5 chow; n = 6 DIO.
Figure 4. Obese mice do not lack hypothalamic stem cells but have a reduced number of actively proliferating cells.
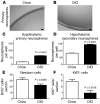
The number of hypothalamic neural stem/progenitor cells in 16-week-old mice was examined using the neurosphere assay. (A and B) Neurospheres derived from DIO mice were of a similar size and appearance as those derived from lean controls. (C) However, DIO mice contain a higher number of hypothalamic neurosphere-forming cells than lean controls (n = 4 mice each; 2,000 cells plated per well). (D) Neurospheres from both DIO mice and lean controls expanded after passage. However, a greater number of secondary neurospheres were formed in DIO mice than in lean controls. (E) Sixteen-week-old mice were i.p. injected with BrdU and harvested 48 hours later. The number of newborn BrdU+ cells was significantly decreased in DIO mice compared with that in lean controls, although this decrease appeared mild compared with the loss observed 4 weeks after BrdU administration (see Figure 1). (F) This decrease in BrdU-labeled cells was mirrored by a reduction in Ki67-expressing glia in DIO mice compared with that in lean controls. Data are mean ± SEM. n = 4–7 chow; n = 4–5 DIO. Scale bar: 1 mm.
Figure 5. DIO results in the apoptosis of newly dividing cells.
Proliferating cells in 16-week-old DIO mice and lean controls were cumulatively labeled with 5 i.p. injections of BrdU and assayed for apoptosis 48 hours later using the TUNEL method. (A–C) Unlike lean mice in which no newly divided cells were apoptotic, several newly divided cells were apoptotic in DIO mice, indicating that the failure of hypothalamic neurogenesis is partially due to the apoptosis of newborn cells. (D) There was no difference in the overall rate of apoptosis in the ARN between DIO mice and lean controls. Data are mean ± SEM. n = 5 chow; n = 5 DIO. Scale bar: 100 μm.
Figure 6. Calorie restriction partially restores neurogenesis in DIO mice.
Sixteen-week-old DIO mice were either maintained on HFD or calorie restricted. (A) Four weeks of calorie restriction did not affect the number of hypothalamic neurosphere-forming cells observed with DIO mice. (B) However, calorie restriction restored the proliferation of neuronal progenitor cells in DIO mice. Data are mean ± SEM. n = 3–5 chow; n = 4–5 DIO. ad lib, ad libitum; CR, calorie restriction.
Figure 7. HFD feeding inhibits remodeling of the ARN energy-balance circuit.
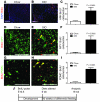
ARN neurons were labeled with BrdU during embryogenesis. Mice were divided into a HFD-fed and a chow-fed cohort at 6 weeks, and BrdU-labeled embryonic neurons were assayed after 10 weeks of differential feeding. (A–C) In mice continually fed a chow diet, few labeled ARN neurons (BrdU [red] and DAPI [blue]) remained at 16 weeks, but a significantly greater number of labeled ARN neurons remained in littermates placed on HFD at 6 weeks of age. (D–F) A similar retention of labeled NPY neurons (yellow arrowheads) was found in HFD-fed mice (BrdU [red] and NPY [green]). (G–I) A similar retention of labeled POMC neurons (yellow arrowheads) was found in HFD-fed mice (BrdU [red] and POMC [green]). (J) Schematic of analysis. Mean ± SEM. Scale bar: 100 μm.
Figure 8. Loss of neural stem cells and neurogenesis in mice lacking leptin.
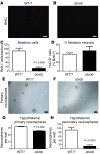
(A–C) Hypothalamic neurogenesis is almost completely abolished in 16-week-old obese ob/ob mice lacking leptin compared with that in lean littermates (WT/WT or WT/ob [WT/?]). (D) However, there was no difference in the percentage of cells adopting a neuronal fate (HuC/D+) between the 2 groups. (E–G) The number of neurosphere-generating cells is reduced in the hypothalamus of ob/ob mice compared with that in lean littermates (2,000 cells plated per well). (H) The majority of primary neurosphere-forming cells present in ob/ob mice are not stem cells, as they fail to generate new neurospheres after passage. Mean ± SEM. Scale bar: 1 mm.
Figure 9. Leptin infusion increases the number of neurosphere-forming neural stem/progenitor cells in vivo but does not directly increase neurogenesis acutely.
(A) Sixteen-week-old mice were infused with leptin peripherally for 14 days. Leptin-treated mice contained higher numbers of neurosphere-forming cells than vehicle-infused control mice. (B) Acute central infusion of leptin and BrdU did not alter the rate of hypothalamic neurogenesis compared with that in mice infused with BrdU alone. Mean ± SEM.
Comment in
- Alteration of hypothalamic cellular dynamics in obesity.
Lee EB, Ahima RS. Lee EB, et al. J Clin Invest. 2012 Jan;122(1):22-5. doi: 10.1172/JCI61562. Epub 2011 Dec 27. J Clin Invest. 2012. PMID: 22201678 Free PMC article.
Similar articles
- ROCK1 in AgRP neurons regulates energy expenditure and locomotor activity in male mice.
Huang H, Lee SH, Ye C, Lima IS, Oh BC, Lowell BB, Zabolotny JM, Kim YB. Huang H, et al. Endocrinology. 2013 Oct;154(10):3660-70. doi: 10.1210/en.2013-1343. Epub 2013 Jul 24. Endocrinology. 2013. PMID: 23885017 Free PMC article. - Cyclin-dependent kinase 4/6 inhibitors require an arcuate-to-paraventricular hypothalamus melanocortin circuit to treat diet-induced obesity.
Iqbal NJ, Schwartz GJ, Zhao H, Zhu L, Chua S , Jr. Iqbal NJ, et al. Am J Physiol Endocrinol Metab. 2021 Mar 1;320(3):E467-E474. doi: 10.1152/ajpendo.00386.2020. Epub 2020 Dec 28. Am J Physiol Endocrinol Metab. 2021. PMID: 33356996 Free PMC article. - Sirt6 in pro-opiomelanocortin neurons controls energy metabolism by modulating leptin signaling.
Tang Q, Gao Y, Liu Q, Yang X, Wu T, Huang C, Huang Y, Zhang J, Zhang Z, Li R, Pu S, Zhang G, Zhao Y, Zhou J, Huang H, Li Y, Jiang W, Chang Y, He J. Tang Q, et al. Mol Metab. 2020 Jul;37:100994. doi: 10.1016/j.molmet.2020.100994. Epub 2020 Apr 9. Mol Metab. 2020. PMID: 32278654 Free PMC article. - The Role of PVH Circuits in Leptin Action and Energy Balance.
Sutton AK, Myers MG Jr, Olson DP. Sutton AK, et al. Annu Rev Physiol. 2016;78:207-21. doi: 10.1146/annurev-physiol-021115-105347. Annu Rev Physiol. 2016. PMID: 26863324 Free PMC article. Review. - Mechanistic insight into high-fat diet-induced metabolic inflammation in the arcuate nucleus of the hypothalamus.
Ullah R, Rauf N, Nabi G, Yi S, Yu-Dong Z, Fu J. Ullah R, et al. Biomed Pharmacother. 2021 Oct;142:112012. doi: 10.1016/j.biopha.2021.112012. Epub 2021 Aug 10. Biomed Pharmacother. 2021. PMID: 34388531 Review.
Cited by
- Alteration of hypothalamic cellular dynamics in obesity.
Lee EB, Ahima RS. Lee EB, et al. J Clin Invest. 2012 Jan;122(1):22-5. doi: 10.1172/JCI61562. Epub 2011 Dec 27. J Clin Invest. 2012. PMID: 22201678 Free PMC article. - Liraglutide Counteracts Endoplasmic Reticulum Stress in Palmitate-Treated Hypothalamic Neurons without Restoring Mitochondrial Homeostasis.
Griffin H, Sullivan SC, Barger SW, Phelan KD, Baldini G. Griffin H, et al. Int J Mol Sci. 2022 Dec 30;24(1):629. doi: 10.3390/ijms24010629. Int J Mol Sci. 2022. PMID: 36614074 Free PMC article. - Multifaceted secretion of htNSC-derived hypothalamic islets induces survival and antidiabetic effect via peripheral implantation in mice.
Tang Y, Zuniga-Hertz JP, Han C, Yu B, Cai D. Tang Y, et al. Elife. 2020 Feb 21;9:e52580. doi: 10.7554/eLife.52580. Elife. 2020. PMID: 32081132 Free PMC article. - The Role of Lipid Metabolism for Neural Stem Cell Regulation.
Knobloch M. Knobloch M. Brain Plast. 2017 Nov 9;3(1):61-71. doi: 10.3233/BPL-160035. Brain Plast. 2017. PMID: 29765860 Free PMC article. Review. - Traumatic Brain Injury: At the Crossroads of Neuropathology and Common Metabolic Endocrinopathies.
Li M, Sirko S. Li M, et al. J Clin Med. 2018 Mar 14;7(3):59. doi: 10.3390/jcm7030059. J Clin Med. 2018. PMID: 29538298 Free PMC article. Review.
References
- Anand BK, Brobeck JR. Localization of a feeding center in the hypothalamus of the rat. Proc Soc Exp Biol Med. 1951;77(2):323–324. - PubMed
Publication types
MeSH terms
Substances
LinkOut - more resources
Full Text Sources
Other Literature Sources
Medical
Molecular Biology Databases


