Activation-induced cytidine deaminase expression in CD4+ T cells is associated with a unique IL-10-producing subset that increases with age - PubMed (original) (raw)
Activation-induced cytidine deaminase expression in CD4+ T cells is associated with a unique IL-10-producing subset that increases with age
Hongyan Qin et al. PLoS One. 2011.
Abstract
Activation-induced cytidine deaminase (AID), produced by the Aicda gene, is essential for the immunoglobulin gene (Ig) alterations that form immune memory. Using a Cre-mediated genetic system, we unexpectedly found CD4(+) T cells that had expressed Aicda (exAID cells) as well as B cells. ExAID cells increased with age, reaching up to 25% of the CD4(+) and B220(+) cell populations. ExAID B cells remained IgM(+), suggesting that class-switched memory B cells do not accumulate in the spleen. In T cells, AID was expressed in a subset that produced IFN-γ and IL-10 but little IL-4 or IL-17, and showed no evidence of genetic mutation. Interestingly, the endogenous Aicda expression in T cells was enhanced in the absence of B cells, indicating that the process is independent from the germinal center reaction. These results suggest that in addition to its roles in B cells, AID may have previously unappreciated roles in T-cell function or tumorigenesis.
© 2011 Qin et al.
Conflict of interest statement
Competing Interests: This study was partly funded by Boehringer Ingelheim. There are no patents, products in development or marketed products to declare. This does not alter the authors' adherence to all the PLoS ONE policies on sharing data and materials, as detailed online in the guide for authors.
Figures
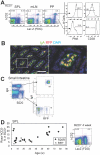
Figure 1. Aicda-cre/R26R or /Rosa-tdRFP B cells are efficiently marked upon their activation in vivo.
(A) Peripheral lymphoid organs of Aicda-cre/R26R 21-week-old mice were stained with B220, human CD2, PNA, and CD38. Histograms show CD38 and PNA expressed in LacZ+ hCD2+ and LacZ+ hCD2− cells. SPL, spleen; mLN, mesenteric lymph node; PP, Peyer's patch. (B) Immunofluorescence analysis of the small intestine of an Aicda-cre/Rosa-tdRFP mouse. IgA (green), RFP (red), and DAPI (blue) signals are shown together. The right panel shows an enlarged view of the area outlined in the left panel. Bar represents 100 µm. (C) FACS analysis of lamina propria cells from the small intestine of an Aicda-cre/Rosa-tdRFP mouse. (D) The percentage of B cells with the Rosa+ (LacZ or RFP) hCD2− among B220+ cells in the spleen, plotted by age (in weeks); symbols indicate individual mice. Correlation coefficient (r) was 0.65. Human CD2 and LacZ expression in B220+ spleen cells from a 4-week-old Aicda-cre/R26R mouse are shown (rightmost panel).
Figure 2. Low-level Aicda expression visualized in immature B cells.
(A) Bone marrow (BM) cells of 7-week-old Aicda-cre/R26R mice were stained by the indicated markers. The corresponding gate for each panel is indicated. Numbers in each quadrant indicate the percentage of gated cells. (B) Aicda-cre/R26R spleen (SPL) cells were stained for the indicated markers. Gated areas are indicated in the top panels. (A)(B) Mean values and standard deviations of the percentage of LacZ+ cells in three 7∼8-week old mice were as following: preB = 0.33±0.16, imB = 1.03±0.23, T1 = 4.96±1.35, T2 = 7.74±2.99, mB = 7.96±2.69, MZB = 6.54±2.97. (C) Aicda expression is shown for each B-cell stage detected by RT-PCR; values were normalized to the Gapdh expression. Expression levels are presented relative to the average signal of germinal center B cells. The data represent the average of three independent experiments with standard deviation. R1, region 1; R2, region 2; preB, premature B cell; imB, immature B cell; T1, transitional B cell 1; T2, transitional B cell 2; mB, mature B cell; MZB, marginal zone B cell; GCB, germinal center B cell.
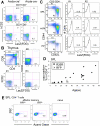
Figure 3. Aicda-cre/R26R mice reveal the history of Aicda expression in a subset of T cells.
Spleen T cells (A), thymocytes (B), and peripheral lymphoid organs (C) from Aicda-cre/R26R mice were stained with the markers indicated. The gating used for each plot is shown at the top of each panel. Data shown is for 29-week-old (A and C) or 7-week-old (B) animals. Numbers in the panels show the percentage of gated cells of each quadrant/gate. (A) R26R (Aicda-cre−) is shown as a negative control. (C) R1 and R2 gating represents EM and naive T-cell populations, respectively. FACS data shown in (B) are representative of analyses of the thymus in three independent experiments, using mice aged 7, 15, and 18 weeks. (D) The percentage of LacZ+ (diamond) or RFP+ (cross) cells in CD4+ T cells in the spleen, plotted by age. Symbols represent individual mice. Correlation coefficient (r) was 0.86. (E) Aicda-cre/Rosa-tdRFP/Fucci mouse (64-week) spleen TCRβ+CD4+ cells were sorted into CD44hi RFP+ and RFP− EM cells as well as CD44lo naïve cells. Cells were gated to the S/G2/M phase of the cell cycle. Results are representative of analyses of 4 animals. SPL, spleen; mLN, mesenteric lymph node; PP, Peyer's patch; R1, region 1; R2, region 2; R3, region 3.
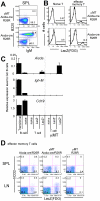
Figure 4. T-B interaction is not required for Aicda expression in T cells.
(A) Results of B220 and IgM staining of Aicda-cre/R26R/μMT and Aicda-cre/R26R spleen (SPL) cells from 35-week-old animals are shown. (B) LacZ expressed in Aicda-cre/R26R/μMT (upper) and Aicda-cre/R26R (lower) spleen T cells. Naive and EM CD4+ T cells were gated as populations with CD3+CD4+CD62LhiCD44lo and CD3+CD4+CD62LloCD44hi phenotypes, respectively. FACS data shown are representative of five independent experiments. (C) Endogenous Aicda mRNA expression in peripheral B and CD4+ T cells was quantified by real-time PCR with Taqman® probes. Pooled spleen and lymph node cells were sorted and analyzed. Each value was normalized to the Ppib signal and shown as a number relative to the signal of germinal center B cells in each experiment; therefore, in this graph, one corresponds to the signal equivalent to germinal center B cells. The error bar indicates the standard deviation of triplicate PCR. The results are representative of two independent sorting experiments using two animals each. The following markers were used to define each fraction: germinal center B, B220+ CD38−; transitional B, B220+ IgMhi IgDlo CD21lo; naive B, B220+ IgDhi IgMlo; naive T, B220− CD3+ CD4+ CD62Lhi CD44lo LacZ−; EM T (LacZ−), B220− CD3+ CD4+ CD62Llo CD44hi LacZ−; and EM T (LacZ+), B220− CD3+ CD4+ CD62Llo CD44hi LacZ+. (D) Human CD2 and LacZ expression in the peripheral CD4+ T-cell fraction in 33-week-old Aicda-cre/R26R/μMT mice. EM T cells (B220− CD3+ CD4+ CD62Llo) in the spleen (SPL) or lymph node (LN) were examined for each mouse with the indicated genotype. Percentage within the gate is indicated.
Figure 5. The localization of exAID CD3+ cells in Peyer's patches.
Left panel: an image of a Peyer's patch, taken with a low power field, stained with CD3 (green), AID (blue), and RFP (red). The section was cut at the position where the germinal center was dense. The dotted line indicates part of a T-B border. Bar represents 200 µm. Right panels: enlarged view of the area indicated in the left panel. White arrows indicate CD3+ RFP+ double-positive cells.
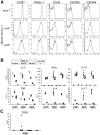
Figure 6. Distinct functional feature of exAID T cells.
(A) Naive T (CD3+ CD4+ CD62Lhi CD44lo) and EM T (CD3+ CD4+ CD62Llo CD44hi) cells, with or without LacZ, from Aicda-cre/R26R spleens were gated and examined for the indicated molecules. (B) Cytokine production of naive (diamond) and EM (LacZ−, triangle; LacZ+, square) T-cell fractions after stimulation with PMA and ionomycin is shown for the indicated time points. Unstimulated LacZ− EM cells (non-stim., cross) were used as negative controls. Each symbol represents the result of an individual sample of multiple cultures (naive, n = 2; LacZ+, n = 6; LacZ−, n = 8; non-stim., n = 4). (C) TGF-β production 48 hours after PMA ionomycin addition, measured by ELISA. Symbols are the same as in (B). The result is representative of three independent experiments. IL, interleukin; IFN, interferon; TNF, tumor necrosis factor.
Figure 7. Generation of exAID CD4+ T cells in vivo by Adoptive transfer to CD3ε−/− mice.
(A) RFP expression of CD4+ T cells recovered from spleen, mesenteric lymph node, and small intestine of CD3ε−/− mice transferred indicated phenotype of T cells. (B) CD4+ T cells that were recovered from the spleen, mesenteric lymph node, Peyer's patch, small intestine and large intestine of the mice transferred RFP− EM (n = 3; square) and RFP+ EM CD4+ T cells (n = 3; triangle) as well as naïve T cells (n = 2; square) were pooled; the total number of cells was counted and plotted. Average numbers are shown by column graphs. (C) IFN-γ and IL-10 double producing cell from EM CD4+ T cells after the adoptive transfer. IFN-γ and IL-10 expression in spleen CD4+ T cells obtained from T-cell-transferred CD3ε−/− mice were analyzed by intra-cellular cytokine staining. Recovered cells were stimulated with PMA and ionomycin for 4 hours before the staining. SPL, spleen; mLN, mesenteric lymph node; Si, small intestine; memory, effector memory.
Similar articles
- IL-10 regulates Aicda expression through miR-155.
Fairfax KA, Gantier MP, Mackay F, Williams BR, McCoy CE. Fairfax KA, et al. J Leukoc Biol. 2015 Jan;97(1):71-8. doi: 10.1189/jlb.2A0314-178R. Epub 2014 Nov 7. J Leukoc Biol. 2015. PMID: 25381386 - Histone deacetylase inhibitors upregulate B cell microRNAs that silence AID and Blimp-1 expression for epigenetic modulation of antibody and autoantibody responses.
White CA, Pone EJ, Lam T, Tat C, Hayama KL, Li G, Zan H, Casali P. White CA, et al. J Immunol. 2014 Dec 15;193(12):5933-50. doi: 10.4049/jimmunol.1401702. Epub 2014 Nov 12. J Immunol. 2014. PMID: 25392531 Free PMC article. - A novel activation-induced cytidine deaminase (AID) mutation in Brazilian patients with hyper-IgM type 2 syndrome.
Caratão N, Cortesão CS, Reis PH, Freitas RF, Jacob CM, Pastorino AC, Carneiro-Sampaio M, Barreto VM. Caratão N, et al. Clin Immunol. 2013 Aug;148(2):279-86. doi: 10.1016/j.clim.2013.05.017. Epub 2013 Jun 7. Clin Immunol. 2013. PMID: 23803409 - Expression of activation-induced cytidine deaminase enhances the clearance of pneumococcal pneumonia: evidence of a subpopulation of protective anti-pneumococcal B1a cells.
Yamamoto N, Kerfoot SM, Hutchinson AT, Dela Cruz CS, Nakazawa N, Szczepanik M, Majewska-Szczepanik M, Nazimek K, Ohana N, Bryniarski K, Mori T, Muramatsu M, Kanemitsu K, Askenase PW. Yamamoto N, et al. Immunology. 2016 Jan;147(1):97-113. doi: 10.1111/imm.12544. Immunology. 2016. PMID: 26456931 Free PMC article. - Activation-induced cytidine deaminase: structure-function relationship as based on the study of mutants.
Durandy A, Peron S, Taubenheim N, Fischer A. Durandy A, et al. Hum Mutat. 2006 Dec;27(12):1185-91. doi: 10.1002/humu.20414. Hum Mutat. 2006. PMID: 16964591 Review.
Cited by
- Evasion of affinity-based selection in germinal centers by Epstein-Barr virus LMP2A.
Minamitani T, Yasui T, Ma Y, Zhou H, Okuzaki D, Tsai CY, Sakakibara S, Gewurz BE, Kieff E, Kikutani H. Minamitani T, et al. Proc Natl Acad Sci U S A. 2015 Sep 15;112(37):11612-7. doi: 10.1073/pnas.1514484112. Epub 2015 Aug 24. Proc Natl Acad Sci U S A. 2015. PMID: 26305967 Free PMC article. - Activation-induced cytidine deaminase is a possible regulator of cross-talk between oocytes and granulosa cells through GDF-9 and SCF feedback system.
Iizuka T, Wakae K, Ono M, Suzuki T, Mizumoto Y, Kitamura K, Horike SI, Muramatsu M, Fujiwara H. Iizuka T, et al. Sci Rep. 2021 Feb 15;11(1):3833. doi: 10.1038/s41598-021-83529-x. Sci Rep. 2021. PMID: 33589683 Free PMC article. - Somatic hypermutation of T cell receptor α chain contributes to selection in nurse shark thymus.
Ott JA, Castro CD, Deiss TC, Ohta Y, Flajnik MF, Criscitiello MF. Ott JA, et al. Elife. 2018 Apr 17;7:e28477. doi: 10.7554/eLife.28477. Elife. 2018. PMID: 29664399 Free PMC article. - T Cell Receptor Alpha Chain Genes in the Teleost Ballan Wrasse (Labrus bergylta) Are Subjected to Somatic Hypermutation.
Bilal S, Lie KK, Sæle Ø, Hordvik I. Bilal S, et al. Front Immunol. 2018 May 22;9:1101. doi: 10.3389/fimmu.2018.01101. eCollection 2018. Front Immunol. 2018. PMID: 29872436 Free PMC article. - miR-15a/16-1 deletion in activated B cells promotes plasma cell and mature B-cell neoplasms.
Sewastianik T, Straubhaar JR, Zhao JJ, Samur MK, Adler K, Tanton HE, Shanmugam V, Nadeem O, Dennis PS, Pillai V, Wang J, Jiang M, Lin J, Huang Y, Brooks D, Bouxsein M, Dorfman DM, Pinkus GS, Robbiani DF, Ghobrial IM, Budnik B, Jarolim P, Munshi NC, Anderson KC, Carrasco RD. Sewastianik T, et al. Blood. 2021 Apr 8;137(14):1905-1919. doi: 10.1182/blood.2020009088. Blood. 2021. PMID: 33751108 Free PMC article.
References
- Muramatsu M, Kinoshita K, Fagarasan S, Yamada S, Shinkai Y, et al. Class switch recombination and hypermutation require activation-induced cytidine deaminase (AID), a potential RNA editing enzyme. Cell. 2000;102:553–563. - PubMed
- Revy P, Muto T, Levy Y, Geissmann F, Plebani A, et al. Activation-induced cytidine deaminase (AID) deficiency causes the autosomal recessive form of the Hyper-IgM syndrome (HIGM2). Cell. 2000;102:565–575. - PubMed
- Honjo T, Kinoshita K, Muramatsu M. Molecular mechanism of class switch recombination: linkage with somatic hypermutation. Annu Rev Immunol. 2002;20:165–196. - PubMed
Publication types
MeSH terms
Substances
LinkOut - more resources
Full Text Sources
Other Literature Sources
Medical
Molecular Biology Databases
Research Materials


