A novel murine model of myeloproliferative disorders generated by overexpression of the transcription factor NF-E2 - PubMed (original) (raw)
. 2012 Jan 16;209(1):35-50.
doi: 10.1084/jem.20110540. Epub 2012 Jan 9.
Albert Gründer, Tobias Hadlich, Julius Wehrle, Monika Gothwal, Ruzhica Bogeska, Thalia S Seeger, Sarah Kayser, Kien-Binh Pham, Jonas S Jutzi, Lucas Ganzenmüller, Doris Steinemann, Brigitte Schlegelberger, Julia M Wagner, Manfred Jung, Britta Will, Ulrich Steidl, Konrad Aumann, Martin Werner, Thomas Günther, Roland Schüle, Alessandro Rambaldi, Heike L Pahl
Affiliations
- PMID: 22231305
- PMCID: PMC3260873
- DOI: 10.1084/jem.20110540
A novel murine model of myeloproliferative disorders generated by overexpression of the transcription factor NF-E2
Kai B Kaufmann et al. J Exp Med. 2012.
Abstract
The molecular pathophysiology of myeloproliferative neoplasms (MPNs) remains poorly understood. Based on the observation that the transcription factor NF-E2 is often overexpressed in MPN patients, independent of the presence of other molecular aberrations, we generated mice expressing an NF-E2 transgene in hematopoietic cells. These mice exhibit many features of MPNs, including thrombocytosis, leukocytosis, Epo-independent colony formation, characteristic bone marrow histology, expansion of stem and progenitor compartments, and spontaneous transformation to acute myeloid leukemia. The MPN phenotype is transplantable to secondary recipient mice. NF-E2 can alter histone modifications, and NF-E2 transgenic mice show hypoacetylation of histone H3. Treatment of mice with the histone deacetylase inhibitor (HDAC-I) vorinostat restored physiological levels of histone H3 acetylation, decreased NF-E2 expression, and normalized platelet numbers. Similarly, MPN patients treated with an HDAC-I exhibited a decrease in NF-E2 expression. These data establish a role for NF-E2 in the pathophysiology of MPNs and provide a molecular rationale for investigating epigenetic alterations as novel targets for rationally designed MPN therapies.
Figures
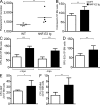
Figure 1.
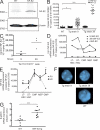
Construction and characterization of tg mice expressing hNF-E2. (A) Western Blot analysis of hNF-E2 expression in an hNF-E2 tg mouse (strain 39) and a WT littermate representative of n = 4 each. BM was harvested from animals of the indicated genotype, and total cell extracts were interrogated with an antibody that recognizes both human and mNF-E2. Equal loading was assured by reprobing with an antibody against β-actin. (B) Quantitation of murine and hNF-E2 expression in tg animals (both strain 9 and 39, as indicated; n > 20 each) and WT littermates. RNA was extracted from peripheral blood cells and assayed for murine and hNF-E2 expression by quantitative RT-PCR. Results are reported as copies of hNF-E2 or mNF-E2 expressed per 105 copies of the β-2-microglobulin housekeeping gene (n > 20 for each genotype). *, P < 0.05; ***, P < 0.001. (C) Transgene expression in erythroid cells. Ter119+/CD71+ double-positive erythroid progenitor cells were FACS sorted from peripheral blood of hNF-E2 tg animals (_n_ = 6, three each from strain 9 and 39, respectively). RNA was isolated and assayed for hNF-E2 expression by quantitative RT-PCR. Results are reported as copies of hNF-E2 expressed per 105 copies of the β-2-microglobulin housekeeping gene. (D) Quantitation of murine and hNF-E2 expression in isolated stem and progenitor cells of tg animals. Defined stem and progenitor cell populations (LT-HSC, ST-HSC, CMP, MEP, and GMP) were FACS sorted from BM of hNF-E2 tg mice strain 9, strain 39, and WT littermate controls (_n_ = 2 each) as described previously (Pronk et al., 2007), and human and mNF-E2 mRNA expression was measured by quantitative RT-PCR as detailed in B. Each animal was measured in duplicate, and averages are depicted. (E) NF-E2 expression in isolated stem and progenitor cells of PV patients and healthy controls. Defined stem and progenitor cell populations (LT-HSC, ST-HSC, CMP, MEP, and GMP) were FACS sorted from PV patients and healthy controls (_n_ = 3 and 4, respectively) as described previously (Majeti et al., 2007; Will and Steidl, 2010), and NF-E2 mRNA expression was measured by quantitative RT-PCR as detailed in B. Mean and standard error of the mean are depicted. *, P < 0.05; **, P < 0.01. (F) FISH analysis of NF-E2 transgene integration. Peripheral blood smears of NF-E2 tg or WT mice (_n_ > 20 for each strain) were probed by interphase FISH using the vav–hNF-E2 tg construct as a probe. For each sample, 100 cells were scored. Representative photographs showing single integration sites in both founder strains are depicted. Bars, 5 µm. (G) β-Globin mRNA expression. RNA was extracted from BM and assayed for murine β-globin mRNA expression and β-2-microglobulin housekeeping gene expression by quantitative RT-PCR. No difference was observed between mice of strains 9 and 39 (n ≥ 8 each). Results are reported as relative expression levels using the ΔΔCt method and were analyzed for statistical significance using the Student’s t test. ***, P < 0.0001. (B, C, and G) Horizontal lines indicate the mean.
Figure 2.
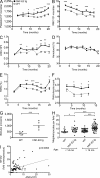
Hematological parameters of hNF-E2 tg and WT mice as well as correlation between NF-E2 expression and ANC in MPN patients. (A–G) Hematological parameters of mice. Peripheral blood was obtained by retroorbital puncture and analyzed on an Advia 120 system. For each time point, between 11 and 55 animals were analyzed. All data include mice of both tg strains, 9 and 39; no differences were observed between the two tg strains. Statistical analysis was conducted using a one-way ANOVA and a Bonferroni post-hoc multiple comparison test: *, P < 0.05; **, P < 0.01; ***, P < 0.001. Error bars indicate standard error of the mean. (A) Platelet counts. (B) WBC count. (C) ANC. (D) Hematocrit. (E) RDW. (F) Reticulocyte count. (G) Plasma serum bilirubin. (H) Number of megakaryocytes per visual field in BM sections of hNF-E2 tg mice and WT littermates. BM sections of hNF-E2 tg mice and WT littermates were stained with H&E, and megakaryocytes were identified morphologically. The number of megakaryocytes in 10 visual fields per mouse (100× magnification) was counted and is depicted stratified by age (n = 13, 31, 34, and 53 mice, respectively). Data include mice of both strains, 9 and 39; no differences were observed between the two tg strains. *, P < 0.05; ***, P < 0.001. (G and H) Horizontal lines indicate the mean. (I) ANC in MPN patients in relationship to NF-E2 mRNA expression (fold NF-E2 overexpression is defined as the fold increase over the mean of 50 healthy controls). ANC values of 80 MPN patients were obtained during routine follow-up. NF-E2 mRNA expression was determined in peripheral blood granulocytes of the same blood draw. The association was assessed using Spearman’s correlation coefficient: P = 0.0004.
Figure 3.
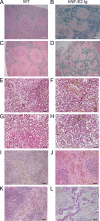
Histopathology of hNF-E2 tg mice. (A–D) Prussian blue staining of spleens of hNF-E2 tg mice (right) and control mice (left). Iron deposits stain blue. (E–H) Gomori’s silver staining of spleens of hNF-E2 tg mice (right) and control mice (left). Reticulin fibers stain black. (I–L) Elastica van Gieson stain of spleens of hNF-E2 tg mice (right) and WT mice (left). Elastic fibers and nuclei stain black, collagen stains red, and smooth muscle stains yellow. The increase in iron deposits, fibrosis, and neovascularization was seen in mice of both tg strains, 9 and 39 (n > 50 each), to the same extent. Bars: (A–D) 100 µm; (E–H) 25 µm; (I–L) 50 µm.
Figure 4.
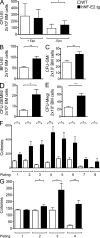
Hematopoietic progenitor cell enumeration and replating capacity in NF-E2 tg and control mice. (A–E) BM cells were seeded in methylcellulose (A–D) or collagen medium (E) to determine colony-forming potential. All data include mice of both tg strains, 9 and 39; no differences were observed between the two tg strains. Before scoring, methylcellulose dishes were stained with benzidine to allow identification of CFU-E and BFU-E. CFU-E were scored on day 4, and BFU-E, CFU-GM, and CFU-GEMM were scored on day 8. CFU-Meg were scored on day 12. Mean and standard deviation of at least 10 independent mice of each genotype are shown. (A) CFU-E. (B) BFU-E. (C) CFU-GM. (D) CFU-GEMM. (E) CFU-Meg. (F and G) Replating capacity of BM from hNF-E2 tg and WT littermates in the FVB/N background (both 9 and 39; n = 4 and 7, respectively; F) and the C57BL/6 backcrossed background (n = 6 each; G). BM cells were seeded in methylcellulose, and the number of colonies was scored after 8 d. Subsequently, the cells were harvested and subjected to a second round of colony growth. After 8 d, colonies were again scored and replated for a third time. In total, eight rounds of replating were performed in FVB/N mice (F) and four rounds in C57BL/6 mice (G). Error bars indicate standard error of the mean. *, P < 0.05; **, P < 0.01.
Figure 5.
Platelet count and hematopoietic progenitor cell enumeration in secondary recipients of hNF-E2 tg and WT BM. (A) Platelet counts in secondary recipients of hNF-E2 tg or WT BM 8 wk after transplantation (n = 5 each). Horizontal lines indicate the mean. (B–F) BM cells of secondary recipients were seeded in methylcellulose to determine colony-forming potential. Before scoring, methylcellulose dishes were stained with benzidine to allow identification of CFU-E and BFU-E. CFU-E were scored on day 4, and BFU-E, CFU-GM, and CFU-GEMM were scored on day 8. Mean and standard deviation of six independently transplanted mice of each genotype are shown. (B) Total number of colonies. (C) CFU-E. (D) BFU-E. (E) CFU-GM. (F) CFU-GEMM. All data include donor mice of both strains, 9 and 39; no differences were observed between the two tg strains. *, P < 0.05; **, P < 0.01; ***, P < 0.001.
Figure 6.
Hematopoietic stem and precursor populations in hNF-E2 tg and WT mice. (A) BM cells were harvested and enumerated; depicted is the number of cells per femur. (B–D) Cells were stained with antibodies against a cocktail of lineage markers as well as against c-kit, Sca-1, CD34, Fc-γR, Thy1.1, and Flt3/Flk2. (B) Lineage-negative, c-kit–positive, Sca-1–negative (KL) and lineage-negative, c-kit–positive, Sca-1–positive (KSL) cells are depicted as a percentage of lineage-negative cells. (C) The absolute number of KL and KSL cells per femur is depicted. (D) CMPs, MEPs, and GMPs were enumerated as previously described (Passegué et al., 2005), and the absolute number of cells per femur is depicted. (E and F) LT-HSCs were analyzed as previously described (Passegué et al., 2005). (E) LT-HSCs are depicted as a percentage of total BM. (F) The absolute number of LT-HSCs per femur is depicted. (G and H) Cells were stained with antibodies against a cocktail of lineage markers as well as against c-kit, Sca-1, CD150, and CD48. HSCs were analyzed as previously described (Kiel et al., 2005). (G) Absolute number of CD150+/CD48− HSCs per femur. (H) Percentage of CD150+/CD48− cells within the KSL (kit+, Sca-1+, lin−) compartment. (A–H) All data include mice of both strains, 9 and 39; no differences were observed between the two tg strains (n = 5–17 per genotype, as indicated). Horizontal lines indicate the mean. *, P < 0.05; **, P < 0.01; ***, P < 0.001.
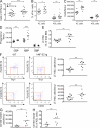
Figure 7.
Disease progression and survival of hNF-E2 tg and WT mice. (A–E) All data include mice of both strains, 9 and 39; no differences were observed between the two tg strains. Representative data of n ≥ 30 animals of each genotype are shown. (A) Kaplan Meyer analysis of survival of hNF-E2 tg and WT mice; n > 50 mice of each genotype were included. P < 0.0001. (B) Representative histology of WT and tg BM, H&E stain. (C) Spleen weights in WT and tg mice. NF-E2 tg mice were divided into three groups, representing weights ± 1 SD of the mean (80–120 mg), <1 SD of the mean (<80 mg), and >1 SD of the mean (>120 mg). Horizontal lines indicate the mean. ***, P < 0.0001. (D) Autopsy of an hNF-E2 tg mouse with gastrointestinal bleeding. (E) Peripheral blood smear of an hNF-E2 tg mouse that developed acute leukemia (WBC 86,000 cells/ml; blast counts: 33% in the peripheral blood, 44% in the BM, and 91% in the spleen; CBCs: Hct 29 [normal 40], Hb 10 [normal 14], platelet count 580 [normal in WT mice: 1,400], and a spleen weight of 863 mg, eight times normal). Bars: (B and E, top) 50 µm; (B and E, bottom) 10 µm.
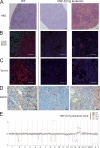
Figure 8.
Phenotypic characterization of the leukemia arising in hNF-E2 tg mice. (A–D) Representative spleen histologies of WT mice (left) and NF-E2 tg mice with leukemic transformation (right). (A) H&E staining. (B) CD3 (green) and B220 (red) immunofluorescence staining. (C) Ter119 immunofluorescence staining. (D) NACE staining. NACE-positive cells stain red. Bars: (A) 100 µm; (B and C) 50 µm; (D) 20 µm. (E) Array-CGH of leukemic hNF-E2 tg mice and WT littermates. Genomic DNA of BM from individual leukemic hNF-E2 tg mice (n = 4, 1 from strain 9 and 3 from strain 39; identified by mouse number in the key) was hybridized to genomic DNA from a pool of n = 10 WT littermates. hNF-E2 tg genomic DNA was labeled with Cy3-dUTP, and WT DNA was stained with Cy5-dUTP. Detection of an equal amount of fluorescence in both DNAs results in a plot along the axis in the middle of the graph. Loss of DNA is depicted as signals below the axis, and gain of genetic material is depicted as signals above the axis.
Figure 9.
Chromatin modifications in hNF-E2 tg and WT mice. (A–D) Western blot analysis and densitometric quantification of histone H3 acetylation (A), histone H4 acetylation (B), H3K27me3 (C), and histone H3K4me3 (D) in BMs of WT and hNF-E2 tg mice (n = 3 and 6, respectively). 10 µg of protein was interrogated for the indicated modification of histone H3 or H4. The blot was stripped and reprobed with an antibody against total histone H3 or histone H4 to ensure equal loading. The ratio of modified histone H3 or H4 to total histone H3 or H4, respectively, was calculated for each animal. One untreated WT littermate was arbitrarily set at 100%, and all other animals were quantitated relative to this calibrator. All data include mice of both strains, 9 and 39; no differences were observed between the two tg strains. Horizontal lines indicate the mean. *, P < 0.05; **, P < 0.01.
Figure 10.
HDAC-I treatment of hNF-E2 tg and WT mice. (A) Western blot analysis of histone H3 acetylation in the spleen of untreated and vorinostat-treated hNF-E2 tg mice (n = 4 of each genotype). (B) mNF-E2 mRNA expression in untreated and vorinostat-treated WT and hNF-E2 tg mice (n ≥ 6 for each group). See legend to Fig. 1 B for methods. Statistical analysis was conducted using a Student’s t test: *, P < 0.05; **, P < 0.01. (C) hNF-E2 mRNA expression in untreated and vorinostat-treated hNF-E2 tg mice (_n_ ≥ 6 for each group). See legend to Fig. 1 B for methods. Statistical analysis was conducted using a Student’s _t_ test: *, P < 0.05. (B and C) Boxes show the 25th and 75th percentile, and the error bars show 1.5 times the interquartile range. (D) Platelet counts in untreated and vorinostat-treated WT and hNF-E2 tg mice at day 0 and 11 (_n_ > 5 for each genotype). The shaded area indicates the normal range for this mouse strain. Statistical analysis was conducted using a one-way ANOVA and a Bonferroni post-hoc multiple comparison test: **, P < 0.01 for tg mice on day 11 versus day 0. Error bars indicate standard deviation of the mean. (E) NF-E2 mRNA expression in MPN patients before and after 84 d of treatment with the HDAC-I givinostat (n = 11 and 7, respectively; Rambaldi et al., 2010). For methods see legend to Fig. 1 B. (A and E) Horizontal lines indicate the mean. *, P < 0.05.
Similar articles
- MPN patients harbor recurrent truncating mutations in transcription factor NF-E2.
Jutzi JS, Bogeska R, Nikoloski G, Schmid CA, Seeger TS, Stegelmann F, Schwemmers S, Gründer A, Peeken JC, Gothwal M, Wehrle J, Aumann K, Hamdi K, Dierks C, Kamar Wang W, Döhner K, Jansen JH, Pahl HL. Jutzi JS, et al. J Exp Med. 2013 May 6;210(5):1003-19. doi: 10.1084/jem.20120521. J Exp Med. 2013. PMID: 23589569 Free PMC article. - RUNX1 and NF-E2 upregulation is not specific for MPNs, but is seen in polycythemic disorders with augmented HIF signaling.
Kapralova K, Lanikova L, Lorenzo F, Song J, Horvathova M, Divoky V, Prchal JT. Kapralova K, et al. Blood. 2014 Jan 16;123(3):391-4. doi: 10.1182/blood-2013-10-534222. Epub 2013 Dec 2. Blood. 2014. PMID: 24297870 Free PMC article. - Overview of Transgenic Mouse Models of Myeloproliferative Neoplasms (MPNs).
Dunbar A, Nazir A, Levine R. Dunbar A, et al. Curr Protoc Pharmacol. 2017 Jun 22;77:14.40.1-14.40.19. doi: 10.1002/cpph.23. Curr Protoc Pharmacol. 2017. PMID: 28640953 Free PMC article. Review. - Deletion of Stat3 in hematopoietic cells enhances thrombocytosis and shortens survival in a JAK2-V617F mouse model of MPN.
Grisouard J, Shimizu T, Duek A, Kubovcakova L, Hao-Shen H, Dirnhofer S, Skoda RC. Grisouard J, et al. Blood. 2015 Mar 26;125(13):2131-40. doi: 10.1182/blood-2014-08-594572. Epub 2015 Jan 16. Blood. 2015. PMID: 25595737 - Metabolic Vulnerabilities and Epigenetic Dysregulation in Myeloproliferative Neoplasms.
Sharma V, Wright KL, Epling-Burnette PK, Reuther GW. Sharma V, et al. Front Immunol. 2020 Nov 30;11:604142. doi: 10.3389/fimmu.2020.604142. eCollection 2020. Front Immunol. 2020. PMID: 33329600 Free PMC article. Review.
Cited by
- A novel biological function of soluble biglycan: Induction of erythropoietin production and polycythemia.
Frey H, Moreth K, Hsieh LT, Zeng-Brouwers J, Rathkolb B, Fuchs H, Gailus-Durner V, Iozzo RV, de Angelis MH, Schaefer L. Frey H, et al. Glycoconj J. 2017 Jun;34(3):393-404. doi: 10.1007/s10719-016-9722-y. Epub 2016 Sep 6. Glycoconj J. 2017. PMID: 27600268 - Mathematical modelling as a proof of concept for MPNs as a human inflammation model for cancer development.
Andersen M, Sajid Z, Pedersen RK, Gudmand-Hoeyer J, Ellervik C, Skov V, Kjær L, Pallisgaard N, Kruse TA, Thomassen M, Troelsen J, Hasselbalch HC, Ottesen JT. Andersen M, et al. PLoS One. 2017 Aug 31;12(8):e0183620. doi: 10.1371/journal.pone.0183620. eCollection 2017. PLoS One. 2017. PMID: 28859112 Free PMC article. - Myeloproliferative neoplasms and inflammation: whether to target the malignant clone or the inflammatory process or both.
Koschmieder S, Mughal TI, Hasselbalch HC, Barosi G, Valent P, Kiladjian JJ, Jeryczynski G, Gisslinger H, Jutzi JS, Pahl HL, Hehlmann R, Maria Vannucchi A, Cervantes F, Silver RT, Barbui T. Koschmieder S, et al. Leukemia. 2016 May;30(5):1018-24. doi: 10.1038/leu.2016.12. Epub 2016 Feb 8. Leukemia. 2016. PMID: 26854026 Review. - CD133 marks a stem cell population that drives human primary myelofibrosis.
Triviai I, Stübig T, Niebuhr B, Hussein K, Tsiftsoglou A, Fehse B, Stocking C, Kröger N. Triviai I, et al. Haematologica. 2015 Jun;100(6):768-79. doi: 10.3324/haematol.2014.118463. Epub 2015 Feb 27. Haematologica. 2015. PMID: 25724578 Free PMC article. - MPN patients harbor recurrent truncating mutations in transcription factor NF-E2.
Jutzi JS, Bogeska R, Nikoloski G, Schmid CA, Seeger TS, Stegelmann F, Schwemmers S, Gründer A, Peeken JC, Gothwal M, Wehrle J, Aumann K, Hamdi K, Dierks C, Kamar Wang W, Döhner K, Jansen JH, Pahl HL. Jutzi JS, et al. J Exp Med. 2013 May 6;210(5):1003-19. doi: 10.1084/jem.20120521. J Exp Med. 2013. PMID: 23589569 Free PMC article.
References
- Bilgrami S., Greenberg B.R. 1995. Polycythemia rubra vera. Semin. Oncol. 22:307–326 - PubMed
Publication types
MeSH terms
Substances
LinkOut - more resources
Full Text Sources
Other Literature Sources
Molecular Biology Databases
Research Materials
