Signaling via the kinase p38α programs dendritic cells to drive TH17 differentiation and autoimmune inflammation - PubMed (original) (raw)
Signaling via the kinase p38α programs dendritic cells to drive TH17 differentiation and autoimmune inflammation
Gonghua Huang et al. Nat Immunol. 2012.
Abstract
Dendritic cells (DCs) bridge innate and adaptive immunity, but how DC-derived signals regulate T cell lineage choices remains unclear. We report here that the mitogen-activated protein kinase p38α programmed DCs to drive the differentiation of the T(H)17 subset of helper T cells. Deletion of p38α in DCs protected mice from T(H)17 cell-mediated autoimmune neuroinflammation, but deletion of p38α in macrophages or T cells did not. We also found that p38α orchestrated the expression of cytokines and costimulatory molecules in DCs and further 'imprinted' signaling via the receptor for interleukin 23 (IL-23R) in responding T cells to promote T(H)17 differentiation. Moreover, p38α was required for tissue-infiltrating DCs to sustain T(H)17 responses. This activity of p38α was conserved in mouse and human DCs and was dynamically regulated by pattern recognition and fungal infection. Our results identify p38α signaling as a central pathway for the integration of instructive signals in DCs for T(H)17 differentiation and inflammation.
Figures
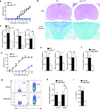
Figure 1. Deletion of p38α in DCs protects mice from EAE
(a) p38 activity in infiltrating myeloid (CD11b+CD45hi) and CNS resident cells (CD11b+CD45lo) in the spinal cord of EAE mice (day 16). (b–e) EAE disease course in tamoxifen-treated wild-type (WT) and p38αCreER mice (b), wild-type and p38αΔT mice (c), wild-type and p38αΔMac mice (d), and wild-type and p38αΔDC mice (e). (f–h) Histopathology (f), histological scores (g) and flow cytometry (h) of spinal cord of wild-type or p38αΔDC EAE mice (day 16). Images are 10× (H&E, α-Iba1 and α-GFAP) and 20× (Luxol fast blue and α-CD3) original magnification (f). Each symbol represents an individual mouse and small horizontal lines indicate the mean (h). *P < 0.05; **P < 0.01; ***P < 0.001 (Student’s _t_-test). Data are representative of 2 (a,h, n=4 mice per group; d,f,g, n≥5 mice per group), 3 (b,c, n≥5 mice per group) and 4 (e, n≥5 mice per group) independent experiments. Error bars indicate SEM.
Figure 2. p38α deficiency in DCs impairs the generation of TH17 cells in vivo
(a) RNA analysis of spinal cord cells of wild-type (WT) or p38αΔDC EAE mice (day 16). (b) Flow cytometry (left) and proportions (right) of IL-17+, IFN-γ+ (after PMA and ionomycin stimulation) and Foxp3+ cells in CD4+ T cells from spinal cord of wild-type or p38αΔDC EAE mice (day 16). (c) Cytokine secretion by draining LN cells from MOG-immunized wild-type or p38αΔDC mice (day 7) after ex vivo antigen stimulation for 3 days. (d) Expression of IFN-γ and IL-17 in CFSElo populations of draining LN CD4+ T cells isolated from (c), followed by CFSE labeling and then MOG stimulation for 4 days. (e) Analysis of Il17a and Ifng mRNA in draining LN cells from KLH-immunized mice after ex vivo stimulation with KLH for 48 h. (f) Proportions of IL-17+ and IFN-γ+ cells among CD4+ T cells from wild-type or p38αΔDC mouse GALTs. MLN, mesenteric lymph nodes; PP, Peyer’s patches; SI-LP, small intestine lamina propia. Each symbol represents an individual mouse and small horizontal lines indicate the mean (b,f). NS, not significant; *P < 0.05; **P < 0.01; ***P < 0.001 (Student’s _t_-test). Data are representative of 3 independent experiments (a–e, n≥4 mice per group; f, n=3 mice per group). Error bars indicate SEM.
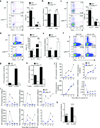
Figure 3. p38α signaling in DCs drives TH17 differentiation in vivo and in vitro and imprints IL-23R expression in responding T cells
(a) Expression of IL-17 and IFN-γ in the MOG TCR-transgenic donor population (Thy1.1+) of draining LN cells from wild-type (WT) or p38αΔDC mice immunized with MOG + CFA. Right, the proportions of IL-17+ and IFN-γ+ populations among donor CD4+ T cells. (b) Analysis of Il17a and Ifng mRNA in draining LN cells isolated from (a) after stimulation with MOG for 48 h. (c) Expression of IL-17 and IFN-γ in the OT-II donor population (Thy1.1+) of draining LN cells from mice immunized with OVA + CFA. Right, the proportions of IL-17+ and IFN-γ+ populations among donor CD4+ T cells. (d) Expression of IL-17 and IFN-γ in OT-II T cells activated with LPS-pulsed wild-type or p38αΔDC DCs for 5 days, followed by PMA and ionomycin stimulation. Right, the proportions of IL-17+ and IFN-γ+ populations. (e) Analysis of Il17a and Ifng mRNA in T cells from (d) after brief α-CD3 stimulation. (f) Expression of IL-17 and IFN-γ in OT-II T cells activated with antigen and LPS-pulsed CD8+ DCs or CD11b+ DCs for 5 days. (g) Analysis of Il17a mRNA in T cells activated with LPS-pulsed wild-type or p38αΔDC DCs in the presence or absence of α-IFN-γ for 5 days. (h) Analysis of Il17a mRNA in T cells from C57BL/6 or IFN-αKO mice stimulated with α-CD3 and LPS-pulsed wild-type or p38αΔDC DCs for 5 days. (i,j) RNA analysis of T cells activated with wild-type or p38αΔDC DCs for various times for expression of cytokines, transcription factors (i) and cytokine receptors (j). (k) Analysis of Il17a mRNA in T cells activated with wild-type or p38αΔDC DCs and transduced with control (MIG) or IL-23R expressing retrovirus. The numbers above the bars indicate the ratios of Il17a mRNA expression between wild-type and p38αΔDC DC-stimulated T cells. NS, not significant; *P < 0.05; **P < 0.01 (Student’s _t_-test). Data are representative of 2 (a–c, n≥5 mice per group; f–j, n=4 mice per group), 3 (k, n=4 mice per group) and 4 (d–e, n=4 mice per group) independent experiments. Error bars indicate SEM.
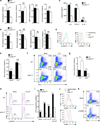
Figure 4. p38α signaling in DCs directs TH17 differentiation by regulating expression of IL-6, IL-27 and CD86
(a) RNA analysis of wild-type (WT) or p38αΔDC splenic DCs isolated from MOG-immunized mice (day 7). (b) RNA analysis of wild-type or p38αΔDC DCs after in vivo stimulation with LPS for 5 h. The baseline level in unstimulated wild-type DCs was set as 1. (c) Cytokine production from wild-type or p38αΔDC DCs after in vitro stimulation with LPS for 24 h. (d) Levels of p-STAT3 and p-STAT4 in T cells activated with antigen and wild-type or p38αΔDC DCs for 2 days in vitro. (e) Analysis of Il23r mRNA in T cells activated with wild-type or p38αΔDC DCs in the presence or absence of IL-6. (f) Expression of IL-17 and IFN-γ in T cells stimulated with wild-type or p38αΔDC DCs in the presence or absence of IL-6 for 5 days. (g) Analysis of Il27 and Spp1 mRNA in wild-type or p38αΔDC splenic DCs from MOG-immunized mice (day 7). (h) Levels of p-STAT3 in T cells activated with wild-type or p38αΔDC DCs in the presence or absence of α-IL-27 antibodies for 2 days. Red line, isotype control. (i) Analysis of Il17a mRNA in T cells stimulated with wild-type or p38αΔDC DCs in the presence or absence of IL-6, α-IL-27 or IL-6 + α-IL-27 for 5 days. The numbers above the bars indicate the ratios of Il17a mRNA expression between wild-type and p38αΔDC DC-stimulated T cells. (j) Expression of CD80 and CD86 on wild-type or p38αΔDC splenic DCs after in vivo LPS stimulation for 5 h. (k) Expression of IL-17 and IFN-γ in T cells activated with LPS-pulsed wild-type DCs in the presence or absence of α-CD86 for 5 days. NS, not significant; *P < 0.05; **P < 0.01 (Student’s _t_-test). Data are representative of 2 (a,g, n≥5 mice per group; j, n=4 mice per group), 3 (f,h,i,k, n=4 mice per group) and 4 (b,c,d,e, n=4 mice per group) independent experiments. Error bars indicate SEM.
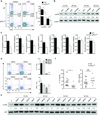
Figure 5. p38α signaling in DCs integrates TH17-instructive signals derived from PRRs and infectious agents
(a) Expression of IL-17 and IFN-γ in the OT-II donor population (Thy1.1+) of draining LN cells from wild-type (WT) or p38αΔDC mice immunized with OVA + LPS or curdlan. Right, the proportions of IL-17+ populations among donor CD4+ T cells. (b) Activation of p38 in splenic DCs stimulated with LPS or curdlan. Numbers below p-p38 lanes indicate band intensity relative to that of β-actin (loading control). (c) mRNA analysis of donor T cells isolated from draining LN cells of OVA + curdlan immunized mice as in (a). (d) Expression of IL-17 and IFN-γ in the donor population (Thy1.1+) of draining LN cells from mice immunized with antigen plus 2 × 10⁷/mouse heat-killed S. cerevisiae (HKSC), C. albicans (HKCA), L. monocytogenes (HKLM) or L. pneumophila (HKLP). Right, the proportions of IL-17+ and IFN-γ+ populations among donor CD4+ T cells. (e) Activation of p38 in splenic DCs stimulated with 107/ml HKSC, HKCA, HKLM or HKLP. Numbers below p-p38 lanes indicate band intensity relative to that of p38. (f) Cytokine secretion from splenocytes isolated from live _C. albicans_-infected mice, followed by stimulation with HKCA for 48 h. Each symbol represents an individual mouse and small horizontal lines indicate the mean. NS, not significant; *P < 0.05 (Student’s _t_-test). Data are representative of 2 (a,c,d,f, n≥5 mice per group) and 3 (b,e, n=5 mice per group) independent experiments. Error bars indicate SEM.
Figure 6. p38α regulates a core set of downstream effector pathways in DCs to mediate diverse upstream signals
(a,b) Analysis of Il6 mRNA in wild-type (WT) or p38αΔDC DCs after in vivo stimulation with curdlan (a) or α-CD40 (b) for 5 h. (c) Cytokine production from wild-type or p38αΔDC DCs after in vitro stimulation with curdlan or α-CD40 for 24 h. (d) Immunoblot analysis of p38α downstream targets in LPS-stimulated wild-type or p38αΔDC DCs. p-, phosphorylated. β-actin, the loading control. (e) Immunoblot analysis of p38α and downstream targets in curdlan and α-CD40-stimulated DCs from wild-type or p38αCreER mice after treatment with tamoxifen. (f) IL-6 production from DCs stimulated with LPS, curdlan or α-CD40 in the presence of the MK2 inhibitor or vehicle for 24 h. (g,h) Intracellular staining (g) and RNA analysis (h) of IL-17 and IFN-γ expression from T cells incubated for 5 days with DCs previously pulsed with LPS in the presence of the MK2 inhibitor or vehicle. NS, not significant; *P < 0.05; **P < 0.01 (Student’s _t_-test). Data are representative of 2 (a,b, n≥5 mice per group), 3 (c–e, n≥4 mice per group) and 4 (f–h, n≥4 mice per group) independent experiments. Error bars indicate SEM.
Figure 7. p38α activity is required for CNS-infiltrating DCs to maintain the TH17 response and is evolutionarily conserved between mouse and human DCs
(a,b) EAE disease course (a) and histology (b) of wild-type (WT) or p38αCreER mice treated with tamoxifen at day 7 after immunization. Images are 4× (H&E) and 20× (Luxol fast blue) original magnification (b). (c) RNA analysis of MOG TCR-transgenic T cells stimulated with antigen and DCs isolated at the peak of disease from the spinal cord of wild-type or p38αCreER mice (treated with tamoxifen at day 13) for 5 days. (d) EAE disease course in wild-type or p38αΔDC mice transferred with in vitro derived TH17 cells. (e) RNA analysis of spinal cord cells from mice in (d). (f) Analysis of Il17a mRNA in T cells incubated for 5 days with mouse DCs previously pulsed with LPS in the presence of the p38 inhibitor SB203580 or vehicle. (g,h) Intracellular staining (g) and RNA analysis (h) of IL-17 and IFN-γ of human cord blood T cells incubated for 7 days with human DCs previously pulsed with LPS in the presence of SB203580 or vehicle. (i) IL-6 production from human DC stimulated with LPS in the presence of SB203580 or vehicle for 24 h. NS, not significant; *P < 0.05; **P < 0.01 (Student’s _t_-test). Data are representative of 2 (b–f: n≥ 4 mice per group) and 3 (a, n=5 mice per group; g–i) independent experiments. Error bars indicate SEM.
Figure 8. p38α and p38β are not required for regulating T cell-intrinsic TH17 differentiation
(a) Expression of IL-17 in wild-type (WT) or p38αΔT naïve T cells differentiated under TH17 conditions for 5 days, followed by PMA and ionomycin stimulation. (b) IL-17 secretion by T cells from (a) after α-CD3 stimulation for 24 h. (c) Expression of IL-17 in naïve T cells from wild-type or p38αΔTp38βKO mice simulated with LPS-pulsed DCs in the presence of IL-6 and TGF-β1 for 5 days, followed by PMA and ionomycin stimulation. (d) Analysis of Il17a mRNA in T cells from (c) after brief α-CD3 stimulation. (e) IL-17 expression in the CFSElo population of draining LN cells isolated from mice immunized with MOG + CFA, followed by CFSE labeling and then stimulation with MOG for 4 days. (f) Expression of IL-17 in the OT-II donor population of draining LN cells from recipients (CD45.1+) immunized with OVA + CFA. NS, not significant (Student’s _t_-test). Data are representative of 2–3 independent experiments (n≥3 mice per group). Error bars indicate SEM.
Similar articles
- Regulation of TH17 cell differentiation by innate immune signals.
Huang G, Wang Y, Chi H. Huang G, et al. Cell Mol Immunol. 2012 Jul;9(4):287-95. doi: 10.1038/cmi.2012.10. Epub 2012 Apr 16. Cell Mol Immunol. 2012. PMID: 22504954 Free PMC article. Review. - Control of IL-17 receptor signaling and tissue inflammation by the p38α-MKP-1 signaling axis in a mouse model of multiple sclerosis.
Huang G, Wang Y, Vogel P, Chi H. Huang G, et al. Sci Signal. 2015 Mar 3;8(366):ra24. doi: 10.1126/scisignal.aaa2147. Sci Signal. 2015. PMID: 25737586 Free PMC article. - The kinase p38α functions in dendritic cells to regulate Th2-cell differentiation and allergic inflammation.
Han M, Ma J, Ouyang S, Wang Y, Zheng T, Lu P, Zheng Z, Zhao W, Li H, Wu Y, Zhang B, Hu R, Otsu K, Liu X, Wan Y, Li H, Huang G. Han M, et al. Cell Mol Immunol. 2022 Jul;19(7):805-819. doi: 10.1038/s41423-022-00873-2. Epub 2022 May 12. Cell Mol Immunol. 2022. PMID: 35551270 Free PMC article. - TLR2-dependent activation of β-catenin pathway in dendritic cells induces regulatory responses and attenuates autoimmune inflammation.
Manoharan I, Hong Y, Suryawanshi A, Angus-Hill ML, Sun Z, Mellor AL, Munn DH, Manicassamy S. Manoharan I, et al. J Immunol. 2014 Oct 15;193(8):4203-13. doi: 10.4049/jimmunol.1400614. Epub 2014 Sep 10. J Immunol. 2014. PMID: 25210120 Free PMC article. - Inflammatory signals in dendritic cell activation and the induction of adaptive immunity.
Joffre O, Nolte MA, Spörri R, Reis e Sousa C. Joffre O, et al. Immunol Rev. 2009 Jan;227(1):234-47. doi: 10.1111/j.1600-065X.2008.00718.x. Immunol Rev. 2009. PMID: 19120488 Review.
Cited by
- The role of dendritic cells in autoimmunity.
Ganguly D, Haak S, Sisirak V, Reizis B. Ganguly D, et al. Nat Rev Immunol. 2013 Aug;13(8):566-77. doi: 10.1038/nri3477. Epub 2013 Jul 5. Nat Rev Immunol. 2013. PMID: 23827956 Free PMC article. Review. - Cutting Edge: Dual Function of PPARγ in CD11c+ Cells Ensures Immune Tolerance in the Airways.
Khare A, Chakraborty K, Raundhal M, Ray P, Ray A. Khare A, et al. J Immunol. 2015 Jul 15;195(2):431-5. doi: 10.4049/jimmunol.1500474. Epub 2015 Jun 10. J Immunol. 2015. PMID: 26062999 Free PMC article. - Derivation and external validation of dendritic cell-related gene signatures for predicting prognosis and immunotherapy efficacy in bladder urothelial carcinoma.
An B, Guo Z, Wang J, Zhang C, Zhang G, Yan L. An B, et al. Front Immunol. 2022 Dec 12;13:1080947. doi: 10.3389/fimmu.2022.1080947. eCollection 2022. Front Immunol. 2022. PMID: 36578478 Free PMC article. - Tristetraprolin regulation of interleukin 23 mRNA stability prevents a spontaneous inflammatory disease.
Molle C, Zhang T, Ysebrant de Lendonck L, Gueydan C, Andrianne M, Sherer F, Van Simaeys G, Blackshear PJ, Leo O, Goriely S. Molle C, et al. J Exp Med. 2013 Aug 26;210(9):1675-84. doi: 10.1084/jem.20120707. Epub 2013 Aug 12. J Exp Med. 2013. PMID: 23940256 Free PMC article. - Advances in kinase inhibition: treating rheumatic diseases and beyond.
Gadina M. Gadina M. Curr Opin Rheumatol. 2014 Mar;26(2):237-43. doi: 10.1097/BOR.0000000000000023. Curr Opin Rheumatol. 2014. PMID: 24419749 Free PMC article. Review.
References
- Korn T, Bettelli E, Oukka M, Kuchroo VK. IL-17 and Th17 Cells. Annu Rev Immunol. 2009;27:485–517. - PubMed
- LeibundGut-Landmann S, et al. Syk- and CARD9-dependent coupling of innate immunity to the induction of T helper cells that produce interleukin 17. Nat Immunol. 2007;8:630–638. - PubMed
- Greter M, et al. Dendritic cells permit immune invasion of the CNS in an animal model of multiple sclerosis. Nat Med. 2005;11:328–334. - PubMed
Publication types
MeSH terms
Substances
Grants and funding
- K01 AR053573-05/AR/NIAMS NIH HHS/United States
- R01 NS064599-04/NS/NINDS NIH HHS/United States
- K01 AR053573/AR/NIAMS NIH HHS/United States
- R01 NS064599/NS/NINDS NIH HHS/United States
- K01 AR053573-03S1/AR/NIAMS NIH HHS/United States
LinkOut - more resources
Full Text Sources
Other Literature Sources
Molecular Biology Databases


