A functional and structural investigation of the human fronto-basal volitional saccade network - PubMed (original) (raw)
A functional and structural investigation of the human fronto-basal volitional saccade network
Sebastiaan F W Neggers et al. PLoS One. 2012.
Abstract
Almost all cortical areas are connected to the subcortical basal ganglia (BG) through parallel recurrent inhibitory and excitatory loops, exerting volitional control over automatic behavior. As this model is largely based on non-human primate research, we used high resolution functional MRI and diffusion tensor imaging (DTI) to investigate the functional and structural organization of the human (pre)frontal cortico-basal network controlling eye movements. Participants performed saccades in darkness, pro- and antisaccades and observed stimuli during fixation. We observed several bilateral functional subdivisions along the precentral sulcus around the human frontal eye fields (FEF): a medial and lateral zone activating for saccades in darkness, a more fronto-medial zone preferentially active for ipsilateral antisaccades, and a large anterior strip along the precentral sulcus activating for visual stimulus presentation during fixation. The supplementary eye fields (SEF) were identified along the medial wall containing all aforementioned functions. In the striatum, the BG area receiving almost all cortical input, all saccade related activation was observed in the putamen, previously considered a skeletomotor striatal subdivision. Activation elicited by the cue instructing pro or antisaccade trials was clearest in the medial FEF and right putamen. DTI fiber tracking revealed that the subdivisions of the human FEF complex are mainly connected to the putamen, in agreement with the fMRI findings. The present findings demonstrate that the human FEF has functional subdivisions somewhat comparable to non-human primates. However, the connections to and activation in the human striatum preferentially involve the putamen, not the caudate nucleus as is reported for monkeys. This could imply that fronto-striatal projections for the oculomotor system are fundamentally different between humans and monkeys. Alternatively, there could be a bias in published reports of monkey studies favoring the caudate nucleus over the putamen in the search for oculomotor functions.
Conflict of interest statement
Competing Interests: The authors have declared that no competing interests exist.
Figures
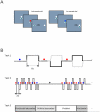
Figure 1. Outline of behavioral paradigms.
A). The stimulus panels used in pro- and antisaccade trials. Panels drawn on the background in this figure are presented first. Instructed eye position as a reaction to each stimulus is indicated in the panels. In reality the targets were presented on a black background. B). Timelines with important events for all 3 tasks. For task 1 and 2, the solid black lines indicate the location of the eye movement target/fixation dot, and the gray solid lines indicate eye position. Colored circles indicate pro and antisaccade cues, and the black cross in the scheme for task 2 indicates a fixation epoch. For further details see the methods section.
Figure 2. Field of view (FOV).
The field of view used for fMRI acquisition during task performance, indicated as a blue translucent square overlaid on a sagittal slice through the anatomical scan of one of the participants. Care was taken that the striatum, midbrain, FEF and SEF were in the field of view. In between functional runs, the angulation was checked regularly and adjusted if required.
Figure 3. Single participant activation maps.
The activation patterns (T-maps) are presented for a representative participant. In the left column (A), a coronal and 2 axial slices are shown with activation during saccades in darkness vs rest in red (task 3) and antisaccades as compared to prosaccades in blue (task 1). In the right column (B) the same slices are shown again with activation for saccades in darkness vs rest in red (task 3) and visual activation during fixation vs rest in green (task 2). Activation maps are overlaid on slices from the normalized anatomical scan of the same subject. In the upper 2 slices activation in the FEF and SEF can be seen, and in the lower slice a zoomed in section of the striatum where saccade activation is observed in the putamen. MNI coordinates of the slices is given in upper right hand side of each slice (y-coordinate for coronal slice, z-coordinate for axial slices). Activation is thresholded at T = 3.5. Slices are displayed in neurological convention (left = left). Labels: SFS: superior frontal sulcus; CS: central sulcus; PUT: Putamen; CN: Caudate Nucleus.
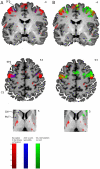
Figure 4. Group activation maps.
Overview of group activation patterns (T-maps) for three tasks. The figure was split into panels A and B as combining activation overlays obscured too much detail due to overlap. Panel A at the left shows event related anti vs prosaccade activation in blue and saccades in darkness activation in red. Panel B at the right shows activation for visual stimulation vs rest in green and again for saccades in darkness vs rest in red. Overlap is rendered in yellow. In the upper row of panel A and B group activation is rendered in 3D on top of a high-quality individual (MNI normalized) skull stripped brain, only to indicate the location of activation with respect to the main sulci and gyri. In the right 3D rendering in panels A and B the anterior upper right part of the brain is cut out to show activation in deeper sulci and along the medial wall of the cortex. In the lower rows activation is overlaid on selected 2D slices through the T1 weighted normalized anatomical scan averaged over all participants, providing a more realistic impression of anatomical precision after normalization. Slice MNI coordinates are given for each slice at the upper right hand side (z-coordinate for axial slices, y for coronal and x for sagittal slices). Activation for all renderings is thresholded at T = 3.5, implying that also some stronger trends are displayed for the sake of completeness. See table 1 for an overview of statistics. Slices are displayed in neurological convention (left = left). Labels are indicating regions of interest or sulci. Lateral and medial FEF (frontal eye fields): two foci activated during saccades in darkness vs rest; antisaccade FEF: preferentially activated for antisaccades vs prosaccades (note that FEF label is only used for sake of simplicity; lateral activations are probably not part of the human FEF homologue). SEF: supplementary eye fields; PUT: Putamen; CS: central sulcus; SFS: superior frontal sulcus; CS: central sulcus.
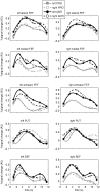
Figure 5. ROI activation timecourse.
The average peri-stimulus-time-histograms (PSTHs; BOLD time courses) are shown for several ROIs: the clusters activated for saccades in darkness vs rest in left and right precentral sulcus/premotor cortex (‘lateral and medial FEF’) and the left and right putamen and SEF, and the left and right clusters in the FEF more active for anti as compared to prosaccades (‘antisaccade FEF’). The aforementioned group activation patterns from which the ROIs were taken are depicted in figure 4. PSTHs were averaged over voxels in the ROIs and then participants, and aligned at target stimulus onset. Saccade onset typically follows within 300 ms, therefore PSTHs aligned at saccade onset would have been largely identical. Data for the left hemisphere are given in the left panels and data for the right hemisphere in the right panels. In each panel, average PSTHs are presented for pro and antisaccades (gray squares and black circles) to the left and right (solid and dashed lines with open and solid symbols). The unit on the ordinate is global % signal change. The absolute magnitude of this unit is not directly meaningful and should not be compared over regions, as averaging took place over different numbers of voxel per region and within different brain areas. Absolute BOLD measures are known to vary considerably over regions. Differences between conditions within a region can be compared. Except the bilateral putamen, the right ‘lateral FEF’ and left SEF, peak activation in all ROIs was significantly larger for antisaccades as compared to prosaccades (p<0.05). The left SEF exhibited larger responses for antisaccades at trend level, T(12) = 1.59;p = 0.06. Further tests on single timepoints of interest are presented in the text of the results section.
Figure 6. Cue evoked activation maps.
Two axial slices with group activation patterns (T-maps) for the second GLM analysis are shown comparing antisaccade cue induced vs prosaccade cue induced activation (from task 1) in blue. Data is overlaid on the T1 weighted anatomical scan averaged over all participants. The z-coordinates (MNI space) is given for each slice at the upper right hand side. Activation is thresholded at T = 3.5. Slices are displayed in neurological convention (left = left).
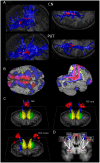
Figure 7. Step-wise results of DTI analysis.
The subsequent steps in DTI fiber analysis are outlined in 4 panels. In panel A, the normalized fiber tracts originating from the left and right putamen and caudate nucleus are rendered in blue for one participant together with orthogonal slices from the normalized T1 weighted scan. The manually segmented ROIs for the caudate nucleus and putamen are also rendered in red. Panel B shows a 3D representation of the average probability (over participants) for a voxel to be connected to the caudate nucleus (in red) or putamen (in blue) or both (purple). In yellow the zones activated for antisaccades and in green the zone activated for saccades in darkness are rendered. For each participant, it was then investigated which fibers from the 4 fiber bundles originating in the left and right putamen and caudate nucleus were connected to the most important cortical fMRI activation clusters observed in 4. See panel C for example results from individual participants: fibers connecting the caudate nucleus and SEF are shown in the left rendering, fibers connecting the putamen and antisaccade zone in the FEF in the right rendering, and the lower left rendering shows fibers connecting the areas activated for saccades in darkness (‘lateral and medial FEF’) with the putamen. The manually segmented caudate nucleus and putamen are also shown in yellow and green, respectively. Panels C is presented in order to illustrate the fiber processing steps, and are not necessarily representative. Panel D shows for how many participants (out of 12) regions were connected at all. ‘FEF motor’ refers to zones along the precentral sulcus activated for saccades in darkness (that is, ‘lateral FEF’ and ‘medial FEF’ taken together), ‘FEF anti’ refers to zones activated for antisaccades vs prosaccades. Line thickness also indicates the number of subjects with connections. The diagram is overlayed onto a blurred slice from figure 4, only to roughly indicate the location.
Similar articles
- Positron emission tomography study of voluntary saccadic eye movements and spatial working memory.
Sweeney JA, Mintun MA, Kwee S, Wiseman MB, Brown DL, Rosenberg DR, Carl JR. Sweeney JA, et al. J Neurophysiol. 1996 Jan;75(1):454-68. doi: 10.1152/jn.1996.75.1.454. J Neurophysiol. 1996. PMID: 8822570 - Human fronto-tectal and fronto-striatal-tectal pathways activate differently during anti-saccades.
de Weijer AD, Mandl RC, Sommer IE, Vink M, Kahn RS, Neggers SF. de Weijer AD, et al. Front Hum Neurosci. 2010 May 26;4:41. doi: 10.3389/fnhum.2010.00041. eCollection 2010. Front Hum Neurosci. 2010. PMID: 20631846 Free PMC article. - Presetting basal ganglia for volitional actions.
Watanabe M, Munoz DP. Watanabe M, et al. J Neurosci. 2010 Jul 28;30(30):10144-57. doi: 10.1523/JNEUROSCI.1738-10.2010. J Neurosci. 2010. PMID: 20668198 Free PMC article. - Neurophysiology and neuroanatomy of reflexive and volitional saccades: evidence from studies of humans.
McDowell JE, Dyckman KA, Austin BP, Clementz BA. McDowell JE, et al. Brain Cogn. 2008 Dec;68(3):255-70. doi: 10.1016/j.bandc.2008.08.016. Epub 2008 Oct 5. Brain Cogn. 2008. PMID: 18835656 Free PMC article. Review. - Different involvement of subregions within dorsal premotor and medial frontal cortex for pro- and antisaccades.
Cieslik EC, Seidler I, Laird AR, Fox PT, Eickhoff SB. Cieslik EC, et al. Neurosci Biobehav Rev. 2016 Sep;68:256-269. doi: 10.1016/j.neubiorev.2016.05.012. Epub 2016 May 19. Neurosci Biobehav Rev. 2016. PMID: 27211526 Free PMC article. Review.
Cited by
- Neural activity in the macaque putamen associated with saccades and behavioral outcome.
Phillips JM, Everling S. Phillips JM, et al. PLoS One. 2012;7(12):e51596. doi: 10.1371/journal.pone.0051596. Epub 2012 Dec 10. PLoS One. 2012. PMID: 23251586 Free PMC article. - Independent component analysis of functional networks for response inhibition: Inter-subject variation in stop signal reaction time.
Zhang S, Tsai SJ, Hu S, Xu J, Chao HH, Calhoun VD, Li CS. Zhang S, et al. Hum Brain Mapp. 2015 Sep;36(9):3289-302. doi: 10.1002/hbm.22819. Epub 2015 Jun 18. Hum Brain Mapp. 2015. PMID: 26089095 Free PMC article. - Single session imaging of cerebellum at 7 Tesla: obtaining structure and function of multiple motor subsystems in individual subjects.
Batson MA, Petridou N, Klomp DW, Frens MA, Neggers SF. Batson MA, et al. PLoS One. 2015 Aug 10;10(8):e0134933. doi: 10.1371/journal.pone.0134933. eCollection 2015. PLoS One. 2015. PMID: 26259014 Free PMC article. - Changes in Effective Connectivity of the Superior Parietal Lobe during Inhibition and Redirection of Eye Movements.
Asscheman SJ, Thakkar KN, Neggers SF. Asscheman SJ, et al. J Exp Neurosci. 2016 Apr 27;9(Suppl 1):27-40. doi: 10.4137/JEN.S32736. eCollection 2015. J Exp Neurosci. 2016. PMID: 27147827 Free PMC article. - Structural Thalamofrontal Hypoconnectivity Is Related to Oculomotor Corollary Discharge Dysfunction in Schizophrenia.
Yao B, Neggers SFW, Rolfs M, Rösler L, Thompson IA, Hopman HJ, Ghermezi L, Kahn RS, Thakkar KN. Yao B, et al. J Neurosci. 2019 Mar 13;39(11):2102-2113. doi: 10.1523/JNEUROSCI.1473-18.2019. Epub 2019 Jan 10. J Neurosci. 2019. PMID: 30630882 Free PMC article.
References
- Hallett PE. Primary and secondary saccades to goals defined by instructions. Vision Res. 1978;18:1279–1296. - PubMed
- Schall JD. Neuronal activity related to visually guided saccades in the frontal eye fields of rhesus monkeys: comparison with supplementary eye fields. J Neurophysiol. 1991;66:559–579. - PubMed
- Bruce CJ, Goldberg ME, Bushnell MC, Stanton GB. Primate frontal eye fields. II. Physiological and anatomical correlates of electrically evoked eye movements. J Neurophysiol. 1985;54:714–734. - PubMed
- Sommer MA, Wurtz RH. Composition and topographic organization of signals sent from the frontal eye field to the superior colliculus. J Neurophysiol. 2000;83:1979–2001. - PubMed
Publication types
MeSH terms
LinkOut - more resources
Full Text Sources
Research Materials


