The alternatively spliced acid box region plays a key role in FGF receptor autoinhibition - PubMed (original) (raw)
The alternatively spliced acid box region plays a key role in FGF receptor autoinhibition
Juliya Kalinina et al. Structure. 2012.
Abstract
Uncontrolled fibroblast growth factor (FGF) signaling can lead to human malignancies necessitating multiple layers of self-regulatory control mechanisms. Fibroblast growth factor receptor (FGFR) autoinhibition mediated by the alternatively spliced immunoglobulin (Ig) domain 1 (D1) and the acid box (AB)-containing linker between D1 and Ig domain 2 (D2) serves as the first line of defense to minimize inadvertent FGF signaling. In this report, nuclear magnetic resonance and surface plasmon resonance spectroscopy are used to demonstrate that the AB subregion of FGFR electrostatically engages the heparan sulfate (HS)-binding site on the D2 domain in cis to directly suppress HS-binding affinity of FGFR. Furthermore, the cis electrostatic interaction sterically autoinhibits ligand-binding affinity of FGFR because of the close proximity of HS-binding and primary ligand-binding sites on the D2 domain. These data, together with the strong amino acid sequence conservation of the AB subregion among FGFR orthologs, highlight the universal role of the AB subregion in FGFR autoinhibition.
Copyright © 2012 Elsevier Ltd. All rights reserved.
Figures
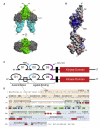
Figure 1. FGF, FGFR, and HS Form a Symmetric 2:2:2 Dimer and Alternative Splicing of the AB/linker Region of FGFR Autoinhibits FGFR Activation and Signaling
(A) Surface representation of the 2:2:2 FGF2-FGFR1c-heparin complex structure (PDB ID 1FQ9; Schlessinger et al., 2000). The molecular surfaces of D2, D3, and FGF are colored green, blue, and gray, respectively. Heparin oligosaccharides are shown as sticks. (B) The surface charge distribution of the D2-D3 region of FGFR1c is shown (PDB ID 1FQ9; Schlessinger et al., 2000). Blue, red, and white represent the positively charged, negatively charged, and neutral regions, respectively. (C) Schematic representation of the two alternatively spliced FGFR3c isoforms with and without the AB/linker region. The AB subregion within the AB/linker is indicated by a black box. The dashed lines show the boundaries of the exon encoding the 23-residue long AB/linker region in panel D. The HBS of the receptor is confined to D2 and is highlighted in cyan. Two alternatively spliced exons (IIIb and IIIc) code for the C-terminal half of D3. (D) Amino acid sequence of the FGFR3c extracellular domain. Secondary structure elements are indicated atop of the sequence. Secondary structures for D2 and D3 are based on the crystal structure of FGF1-FGFR3c (PDB ID 1RY7; Olsen et al., 2004) and for D1 are based on the solution structure of FGFR1c D1 (PDB ID 2CKN; Kiselyov et al., 2006a). The residues comprising the primary ligand-binding site as experimentally determined by the FGF1-FGFR3c structure, and the secondary ligand-binding site as predicted based on the 2:2:2 FGF2-FGFR1c-heparin complex structure (PDB 1D IFQ9; Schlessinger et al., 2000), are highlighted by red and green boxes, respectively. Residues located at the receptor:receptor interface and the HBS of FGFR3c, as predicted based on the crystal structure of the 2:2:2 FGF2-FGFR1c-heparin complex, are highlighted by gray and dark blue boxes, respectively. See also Figure S1 and Table S1.
Figure 2. The AB-mediated Autoinhibition of HS- and Ligand-Binding to FGFR3c Is Intrinsically Present in the Context of the Isolated FGFR3c Ectodomain
(A and B) Representative SPR sensorgrams, illustrating binding of (A) the D1-AB-D2-D3 and (B) D1-D2-D3ΔAB/linker FGFR3c isoforms to heparin. Biotinylated heparin was immobilized on a streptavidin-coated biosensor chip, and increasing concentrations of the receptor ectodomains were passed over the chip. (C and D) Representative SPR sensorgrams showing binding of (C) D1-AB-D2-D3, and (D) D1-D2-D3ΔAB/linker to FGF1. (E and F) Representative SPR sensorgrams illustrating binding of (E) D1-AB-D2-D3 and (F) D1-D2-D3ΔAB/linker to FGF8b. FGF1 and FGF8b were immobilized via random amine coupling onto a CM5 biosensor chip, and increasing concentrations of the ectodomains were flowed over the chip. See also Figure S2.
Figure 3. The AB/Linker Region Interacts Intramolecularly with the HBS of D2 in the D1-AB-D2 Fragment of FGFR3c
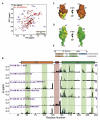
(A) Overlaid 1H-15N-HSQC spectra of D1-AB-D2 (in black) and D1-D2ΔAB/linker (in red) isoforms. Some of the residues experiencing significant chemical shift changes are labeled. The histograms in panel (B) show backbone amide chemical shift differences (Δδ) between (I) D1-AB-D2 and D1-D2ΔAB/linker; (II) D1-AB-D2 and D1-AB/linker; (III) D1-AB-D2 and D1-AB11ALA-D2; (IV) D1-AB11ALA-D2 and D1-D2ΔAB/linker; and (V) D1-AB11ALA-D2 and D2. (VI) The chemical shift differences (Δδ) induced in D1-AB-D2 (100 μM) upon addition of SOS (200 μM). Regions experiencing chemical shift changes greater than 0.08 ppm are highlighted by green and red stripes. Note that residues 204-211, which belong to the secondary ligand-binding site in D2 (Plotnikov et al., 1999), could not be assigned because of their intermediate time scale exchange rate. The significant chemical shift changes observed at the N- and C-terminal regions are expected because of the flexibility of these regions and therefore are not colored. The blue, red, and gray bars denote residues in the D2 domain that participate in HS binding, primary ligand binding, and receptor-receptor interaction, respectively. These perturbed residues are color-coded as in Figure 1D. (C and D) Residues in D1 and D2, experiencing chemical shift perturbations upon deletion/alternative splicing of the AB/linker from D1-AB-D2, are mapped onto the solution structure of FGFR1 D1 domain (PDB ID 2CKN; Kiselyov et al., 2006a) (C) and D2 domain taken from the crystal structure of FGF1-FGFR3c (PDB ID 1RY7; Olsen et al., 2004) (D). The molecular surfaces of D1 and D2 are colored orange and green, respectively, and the perturbed residues are highlighted in yellow. Note that the deletion of the AB/linker region from D1-AB-D2 induces chemical shift perturbations of D1 residues, whereas selective substitution of the acidic residues in the AB of the AB/linker region with alanines does not perturb any residues in D1 (compare Figure 3B-I with Figure 3B-II). These observations, therefore, suggest that D1 interacts with the flanking regions of the AB subregion of the AB/linker. (E) Schematic representation and amino acid boundaries of the alanine-substituted version of FGFR3c constructs generated for chemical shift mapping analyses. D1, D2, D3, and the mutated AB region are colored orange, green, blue, and white, respectively. See Table S1 and Figures S5–S7.
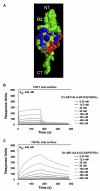
Figure 4. The AB:HBS Interaction Sterically Suppresses Ligand-Binding Affinity of FGFR3c Because of the Close Proximity of Heparin-Binding Site and Primary Ligand-Binding Sites on the D2 Domain
(A) Residues situated in the primary ligand-, the heparin-, and the receptor– receptor binding sites are mapped onto the crystal structure of the D2 domain (PDB ID 1RY7; Olsen et al., 2004). These residues are highlighted in red, blue, and gray, respectively and color-coded are as in Figure 1D. The D2 residues within the yellow boundary are perturbed upon interaction of the AB subregion. (B and C) Representative SPR sensorgrams illustrating binding of D1-AB11ALA-D2-D3 to FGF1 (B) and FGF8b (C). D1-AB11ALA-D2-D3 binds FGF1 and FGF8b with Kds of 344 nM and 440 nM, respectively. By comparison, D1-AB-D2-D3 binds FGF1 and FGF8b with Kds of 622 nM and 888 nM, respectively (Figures 2C and 2E). FGF1 and FGF8b were immobilized on a CM5 biosensor chip, and increasing concentrations of the indicated receptor ectodomains were flowed over the chip.
Figure 5. The AB/Linker Region Exhibits Flexibility in the D1-AB-D2 Fragment of FGFR3c
The 15N{1H}NOE is plotted as a function of residue number of the D1-AB-D2 region. Error bars indicate the standard deviation of the NOE intensity determined from three independent measurements. Residues situated in the well-structured D1 and D2 domains exhibit NOE >0.7. In contrast, residues in the AB/linker region show NOE < 0.5, indicating that this region is flexible. As expected, residues of flexible N- and C-termini of the D1-AB-D2 fragment also exhibit NOE <0.5. Individual domain boundaries and the AB/linker region are indicated atop of the plot. NOEs of four cysteines (C61, C109, C176, and C228) that form two disulfide bridges in the well-structured regions of D1 and D2 are labeled and highlighted in red.
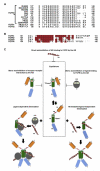
Figure 6. The AB Subregion of the AB/Linker Region Is Highly Conserved among FGFR Orthologs and Acts at Three Levels to Autoinhibit FGFR Signaling
(A) Sequence alignment of the AB/linker region from the indicated FGFR3 orthologs and from fruit fly FGFR1 and FGFR2 indicates that the AB subregion is conserved throughout evolution. (B) Sequence alignment of the AB/linker region from human FGFR1-FGFR4. The residues highlighted by a red box represent the AB subregion. Periods indicate spaces introduced into the sequences to improve the alignments. (C) FGFR exists in a dynamic equilibrium between open and closed conformations. In the closed state, the cis interaction between the AB subregion and the HBS autoinhibits binding of both HS and ligand to the FGFR, thereby suppressing ligand- and HS-mediated receptor dimerization and subsequent FGFR activation. The cis interaction may also sterically inhibit D2-mediated receptor-receptor interaction because of close proximity of the HS and receptor-receptor binding sites on D2. FGF and HS bind to the open state forming the 2:2:2 FGFR:FGF:HS signaling unit. In the open state, the HS binds to the HBS on D2, posing risk of HS-mediated ligand-independent receptor dimerization.
Similar articles
- Heparan sulfate fibroblast growth factor receptor complex: structure-function relationships.
McKeehan WL, Kan M. McKeehan WL, et al. Mol Reprod Dev. 1994 Sep;39(1):69-81; discusison 81-2. doi: 10.1002/mrd.1080390112. Mol Reprod Dev. 1994. PMID: 7999363 Review. - Compositional analysis of heparin/heparan sulfate interacting with fibroblast growth factor.fibroblast growth factor receptor complexes.
Zhang F, Zhang Z, Lin X, Beenken A, Eliseenkova AV, Mohammadi M, Linhardt RJ. Zhang F, et al. Biochemistry. 2009 Sep 8;48(35):8379-86. doi: 10.1021/bi9006379. Biochemistry. 2009. PMID: 19591432 Free PMC article. - Common and specific determinants for fibroblast growth factors in the ectodomain of the receptor kinase complex.
Wang F, Lu W, McKeehan K, Mohamedali K, Gabriel JL, Kan M, McKeehan WL. Wang F, et al. Biochemistry. 1999 Jan 5;38(1):160-71. doi: 10.1021/bi981758m. Biochemistry. 1999. PMID: 9890894 - Insights into the molecular basis for fibroblast growth factor receptor autoinhibition and ligand-binding promiscuity.
Olsen SK, Ibrahimi OA, Raucci A, Zhang F, Eliseenkova AV, Yayon A, Basilico C, Linhardt RJ, Schlessinger J, Mohammadi M. Olsen SK, et al. Proc Natl Acad Sci U S A. 2004 Jan 27;101(4):935-40. doi: 10.1073/pnas.0307287101. Epub 2004 Jan 19. Proc Natl Acad Sci U S A. 2004. PMID: 14732692 Free PMC article. - A protein canyon in the FGF-FGF receptor dimer selects from an à la carte menu of heparan sulfate motifs.
Mohammadi M, Olsen SK, Goetz R. Mohammadi M, et al. Curr Opin Struct Biol. 2005 Oct;15(5):506-16. doi: 10.1016/j.sbi.2005.09.002. Curr Opin Struct Biol. 2005. PMID: 16154740 Review.
Cited by
- Quantitative and qualitative differences in the activation of a fibroblast growth factor receptor by different FGF ligands.
Krzyscik MA, Karl K, Dudeja P, Krejci P, Hristova K. Krzyscik MA, et al. Cytokine Growth Factor Rev. 2024 Aug;78:77-84. doi: 10.1016/j.cytogfr.2024.07.002. Epub 2024 Jul 9. Cytokine Growth Factor Rev. 2024. PMID: 39043538 Review. - The diverse dependence of galectin-1 and -8 on multivalency for the modulation of FGFR1 endocytosis.
Żukowska D, Chorążewska A, Ciura K, Gędaj A, Kalka M, Poźniak M, Porębska N, Opaliński Ł. Żukowska D, et al. Cell Commun Signal. 2024 May 15;22(1):270. doi: 10.1186/s12964-024-01661-3. Cell Commun Signal. 2024. PMID: 38750548 Free PMC article. - Genomic Profiling and Molecular Characterisation of Metastatic Urothelial Carcinoma.
Pezzicoli G, Ciciriello F, Musci V, Minei S, Biasi A, Ragno A, Cafforio P, Rizzo M. Pezzicoli G, et al. Medicina (Kaunas). 2024 Mar 31;60(4):585. doi: 10.3390/medicina60040585. Medicina (Kaunas). 2024. PMID: 38674231 Free PMC article. Review. - The function of alternative splicing in the proteome: rewiring protein interactomes to put old functions into new contexts.
Kjer-Hansen P, Weatheritt RJ. Kjer-Hansen P, et al. Nat Struct Mol Biol. 2023 Dec;30(12):1844-1856. doi: 10.1038/s41594-023-01155-9. Epub 2023 Nov 30. Nat Struct Mol Biol. 2023. PMID: 38036695 Review. - Fibroblast growth factor signaling in axons: from development to disease.
Tomé D, Dias MS, Correia J, Almeida RD. Tomé D, et al. Cell Commun Signal. 2023 Oct 16;21(1):290. doi: 10.1186/s12964-023-01284-0. Cell Commun Signal. 2023. PMID: 37845690 Free PMC article. Review.
References
- Buck M, Xu W, Rosen MK. A two-state allosteric model for autoinhibition rationalizes WASP signal integration and targeting. J. Mol. Biol. 2004;338:271–285. - PubMed
- Cho HS, Leahy DJ. Structure of the extracellular region of HER3 reveals an interdomain tether. Science. 2002;297:1330–1333. - PubMed
Publication types
MeSH terms
Substances
Grants and funding
- R01 GM047021/GM/NIGMS NIH HHS/United States
- GM47021/GM/NIGMS NIH HHS/United States
- P30 NS050276/NS/NINDS NIH HHS/United States
- R01 DE013686-12/DE/NIDCR NIH HHS/United States
- P41 GM066354/GM/NIGMS NIH HHS/United States
- DE13686/DE/NIDCR NIH HHS/United States
- R01 GM047021-15/GM/NIGMS NIH HHS/United States
- R01 DE013686/DE/NIDCR NIH HHS/United States
- R01 DE013686-11/DE/NIDCR NIH HHS/United States
LinkOut - more resources
Full Text Sources
Other Literature Sources
Molecular Biology Databases


