Exercise-induced BCL2-regulated autophagy is required for muscle glucose homeostasis - PubMed (original) (raw)
. 2012 Jan 18;481(7382):511-5.
doi: 10.1038/nature10758.
Michael C Bassik, Viviana Moresi, Kai Sun, Yongjie Wei, Zhongju Zou, Zhenyi An, Joy Loh, Jill Fisher, Qihua Sun, Stanley Korsmeyer, Milton Packer, Herman I May, Joseph A Hill, Herbert W Virgin, Christopher Gilpin, Guanghua Xiao, Rhonda Bassel-Duby, Philipp E Scherer, Beth Levine
Affiliations
- PMID: 22258505
- PMCID: PMC3518436
- DOI: 10.1038/nature10758
Exercise-induced BCL2-regulated autophagy is required for muscle glucose homeostasis
Congcong He et al. Nature. 2012.
Erratum in
- Nature. 2013 Nov 7:503(7474):146
Abstract
Exercise has beneficial effects on human health, including protection against metabolic disorders such as diabetes. However, the cellular mechanisms underlying these effects are incompletely understood. The lysosomal degradation pathway, autophagy, is an intracellular recycling system that functions during basal conditions in organelle and protein quality control. During stress, increased levels of autophagy permit cells to adapt to changing nutritional and energy demands through protein catabolism. Moreover, in animal models, autophagy protects against diseases such as cancer, neurodegenerative disorders, infections, inflammatory diseases, ageing and insulin resistance. Here we show that acute exercise induces autophagy in skeletal and cardiac muscle of fed mice. To investigate the role of exercise-mediated autophagy in vivo, we generated mutant mice that show normal levels of basal autophagy but are deficient in stimulus (exercise- or starvation)-induced autophagy. These mice (termed BCL2 AAA mice) contain knock-in mutations in BCL2 phosphorylation sites (Thr69Ala, Ser70Ala and Ser84Ala) that prevent stimulus-induced disruption of the BCL2-beclin-1 complex and autophagy activation. BCL2 AAA mice show decreased endurance and altered glucose metabolism during acute exercise, as well as impaired chronic exercise-mediated protection against high-fat-diet-induced glucose intolerance. Thus, exercise induces autophagy, BCL2 is a crucial regulator of exercise- (and starvation)-induced autophagy in vivo, and autophagy induction may contribute to the beneficial metabolic effects of exercise.
Figures
Figure 1. Exercise induces autophagy in skeletal and cardiac muscle
a, b, Representative images of GFP–LC3 puncta (autophagosomes) in skeletal (vastus lateralis) (a) and cardiac (b) muscle from GFP–LC3 transgenic mice at serial time points after exercise. Scale bar, 20 μm. c, Quantification of data (mean ± s.e.m. of 10 tissue sections) in a and b. **P < 0.01, ***P < 0.001 (one-way ANOVA). d, Western blot analysis of LC3-I/II (non-lipidated and lipidated forms of MAP1LC3, respectively) and p62 levels in indicated tissue from mice at rest (−) or after maximal exercise (+). Skeletal and cardiac indicate skeletal and cardiac muscle, respectively. e, Co-immunoprecipitation of beclin 1 with BCL2 in muscle tissue from mice at indicated time points after exercise. IP, immunoprecipitate; WB, western blot; WCL, whole cell lysates.
Figure 2. Non-phosphorylatable BCL2 AAA knock-in mutations block BCL2 phosphorylation, BCL2–beclin 1 dissociation, and starvation- and exercise-induced autophagy
a, Analysis of BCL2 phosphorylation (detected by anti-BCL2 immunoprecipitation and autoradiography of 32P-labelled cells) and beclin 1 co-immunoprecipitation with BCL2 in wild-type (WT) or BCL2 AAA MEFs grown in normal media or subjected to 4 h Earle’s balanced salt solution (EBSS) starvation. p-BCL2, phospho-BCL2. b, Quantification of GFP–LC3 puncta (autophagosomes) in MEFs of indicated genotype in normal growth conditions or starvation conditions. Data represent mean ± s.e.m. for 100 cells per well of triplicate samples per condition. Similar results were observed in three independent experiments. c, Representative images of GFP–LC3 puncta (autophagosomes) in skeletal and cardiac muscle of GFP–LC3 wild-type and GFP–LC3 BCL2 AAA mice before exercise, after 80 min exercise, or after 75% of maximal exercise capacity. Scale bar, 20 μm. d, Quantification of data (mean ± s.d. of 4 mice per experimental group) in c. e, Western blot analysis of LC3-I/II and p62 levels in indicated tissue from mice of indicated genotype at rest (−) or after maximal exercise (+). Skeletal and cardiac indicate skeletal and cardiac muscle, respectively. f, Co-immunoprecipitation of beclin 1 with BCL2 in muscle tissue from mice of indicated genotype at rest (−) or after 30 min of exercise. WCL, whole cell lysates. NS, not significant. *P < 0.05, **P < 0.01, ***P < 0.001, one-way ANOVA for comparison between groups; †P < 0.001, two-way ANOVA for comparison of magnitude of changes between different groups in mice of different genotypes.
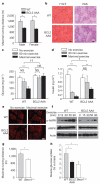
Figure 3. BCL2 AAA mice show deficient exercise endurance and alterations in muscle glucose metabolism
a, Maximal treadmill running distance for mice of indicated genotype. Data represent mean ± s.e.m. of 5 mice per group. b, Representative haematoxylin and eosin (H & E) and periodic acid-Schiff (PAS) staining in tibialis anterior muscle sections from mice of indicated genotype. Scale bar, 20 μm. c, d, Plasma glucose (c) and insulin (d) levels in mice of indicated genotype at rest, after 80 min exercise (~900 m), or maximal exercise. Data represent combined mean ± s.e.m. for 9–11 mice per group from three independent cohorts; similar results were observed in each cohort. e, Representative images of GLUT4 immunofluorescence staining in vastus lateralis muscle of mice of indicated genotype before and after maximal exercise. Scale bar, 20 μm. For b and e, similar results were observed in 3 mice per group. f, Western blot analysis of AMPK phosphorylation (p-AMPK (Thr 172)) in vastus lateralis muscle lysates from mice of indicated genotype at indicated time after exercise. g, Maximal treadmill running distance for mice of indicated genotype. Data represent mean ± s.e.m. of 4–6 male mice per group. h, Soleus muscle 14C-deoxyglucose uptake during treadmill exercise in mice of indicated genotype. Data represent mean ± s.e.m. of 3 mice per group. *P < 0.05, **P < 0.01, ***P < 0.001, one-way ANOVA for comparison between groups; †P < 0.05, ††P < 0.01, two-way ANOVA for comparison of magnitude of changes between different groups in mice of different genotypes. NS, not significant.
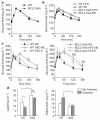
Figure 4. Long-term exercise training protects wild-type but not BCL2 AAA mice from HFD-induced glucose intolerance
a, b, Oral glucose tolerance test (OGTT) before (a, week 0) and after (b, week 4) 4 weeks of HFD. c, d, OGTT (c) and serum leptin and adiponectin levels (d) after 8 weeks of daily exercise. For a–d, results represent the mean ± s.e.m. for 4–5 mice per group. E, exercise; NE, no exercise; RD, regular diet. *P < 0.05, **P < 0.01, (c, one-way ANOVA; d, Wilcoxon rank test). NS, not significant.
Comment in
- Metabolism: Keeping fit with autophagy.
David R. David R. Nat Rev Mol Cell Biol. 2012 Feb 1;13(3):136. doi: 10.1038/nrm3287. Nat Rev Mol Cell Biol. 2012. PMID: 22293615 No abstract available. - Autophagy works out.
Klionsky DJ, Saltiel AR. Klionsky DJ, et al. Cell Metab. 2012 Mar 7;15(3):273-4. doi: 10.1016/j.cmet.2012.02.008. Cell Metab. 2012. PMID: 22405064 Free PMC article.
Similar articles
- TLR9 and beclin 1 crosstalk regulates muscle AMPK activation in exercise.
Liu Y, Nguyen PT, Wang X, Zhao Y, Meacham CE, Zou Z, Bordieanu B, Johanns M, Vertommen D, Wijshake T, May H, Xiao G, Shoji-Kawata S, Rider MH, Morrison SJ, Mishra P, Levine B. Liu Y, et al. Nature. 2020 Feb;578(7796):605-609. doi: 10.1038/s41586-020-1992-7. Epub 2020 Feb 12. Nature. 2020. PMID: 32051584 Free PMC article. - Exercise induces autophagy in peripheral tissues and in the brain.
He C, Sumpter R Jr, Levine B. He C, et al. Autophagy. 2012 Oct;8(10):1548-51. doi: 10.4161/auto.21327. Epub 2012 Aug 15. Autophagy. 2012. PMID: 22892563 Free PMC article. - Mitochondrial adaptations to exercise do not require Bcl2-mediated autophagy but occur with BNIP3/Parkin activation.
Ehrlicher SE, Stierwalt HD, Miller BF, Newsom SA, Robinson MM. Ehrlicher SE, et al. FASEB J. 2020 Mar;34(3):4602-4618. doi: 10.1096/fj.201902594RR. Epub 2020 Feb 6. FASEB J. 2020. PMID: 32030805 Free PMC article. - Impaired autophagy and APP processing in Alzheimer's disease: The potential role of Beclin 1 interactome.
Salminen A, Kaarniranta K, Kauppinen A, Ojala J, Haapasalo A, Soininen H, Hiltunen M. Salminen A, et al. Prog Neurobiol. 2013 Jul-Aug;106-107:33-54. doi: 10.1016/j.pneurobio.2013.06.002. Epub 2013 Jul 1. Prog Neurobiol. 2013. PMID: 23827971 Review. - Autophagy is essential to support skeletal muscle plasticity in response to endurance exercise.
Sanchez AM, Bernardi H, Py G, Candau RB. Sanchez AM, et al. Am J Physiol Regul Integr Comp Physiol. 2014 Oct 15;307(8):R956-69. doi: 10.1152/ajpregu.00187.2014. Epub 2014 Aug 13. Am J Physiol Regul Integr Comp Physiol. 2014. PMID: 25121614 Review.
Cited by
- BNIP3L/Nix-induced mitochondrial fission, mitophagy, and impaired myocyte glucose uptake are abrogated by PRKA/PKA phosphorylation.
da Silva Rosa SC, Martens MD, Field JT, Nguyen L, Kereliuk SM, Hai Y, Chapman D, Diehl-Jones W, Aliani M, West AR, Thliveris J, Ghavami S, Rampitsch C, Dolinsky VW, Gordon JW. da Silva Rosa SC, et al. Autophagy. 2021 Sep;17(9):2257-2272. doi: 10.1080/15548627.2020.1821548. Epub 2020 Oct 12. Autophagy. 2021. PMID: 33044904 Free PMC article. - Mitochondrial dysfunction and sarcopenia of aging: from signaling pathways to clinical trials.
Marzetti E, Calvani R, Cesari M, Buford TW, Lorenzi M, Behnke BJ, Leeuwenburgh C. Marzetti E, et al. Int J Biochem Cell Biol. 2013 Oct;45(10):2288-301. doi: 10.1016/j.biocel.2013.06.024. Epub 2013 Jul 8. Int J Biochem Cell Biol. 2013. PMID: 23845738 Free PMC article. Review. - Autophagy modulation as a target for anticancer drug discovery.
Li X, Xu HL, Liu YX, An N, Zhao S, Bao JK. Li X, et al. Acta Pharmacol Sin. 2013 May;34(5):612-24. doi: 10.1038/aps.2013.23. Epub 2013 Apr 8. Acta Pharmacol Sin. 2013. PMID: 23564085 Free PMC article. Review. - Insulin resistance: metabolic mechanisms and consequences in the heart.
Abel ED, O'Shea KM, Ramasamy R. Abel ED, et al. Arterioscler Thromb Vasc Biol. 2012 Sep;32(9):2068-76. doi: 10.1161/ATVBAHA.111.241984. Arterioscler Thromb Vasc Biol. 2012. PMID: 22895668 Free PMC article. Review. - Induction of autophagy by ARHI (DIRAS3) alters fundamental metabolic pathways in ovarian cancer models.
Ornelas A, McCullough CR, Lu Z, Zacharias NM, Kelderhouse LE, Gray J, Yang H, Engel BJ, Wang Y, Mao W, Sutton MN, Bhattacharya PK, Bast RC Jr, Millward SW. Ornelas A, et al. BMC Cancer. 2016 Oct 26;16(1):824. doi: 10.1186/s12885-016-2850-8. BMC Cancer. 2016. PMID: 27784287 Free PMC article.
References
- Kuma A, Mizushima N. Physiological role of autophagy as an intracellular recycling system: with an emphasis on nutrient metabolism. Semin. Cell Dev. Biol. 2010;21:683–690. - PubMed
Publication types
MeSH terms
Substances
Grants and funding
- R01 AI084887/AI/NIAID NIH HHS/United States
- P01 DK088761/DK/NIDDK NIH HHS/United States
- RCI DK086629/DK/NIDDK NIH HHS/United States
- HHMI/Howard Hughes Medical Institute/United States
- 1P01 DK0887761/DK/NIDDK NIH HHS/United States
- P30 CA142543/CA/NCI NIH HHS/United States
- R0I HL090842/HL/NHLBI NIH HHS/United States
- R01 CA109618/CA/NCI NIH HHS/United States
- R0I AI084887/AI/NIAID NIH HHS/United States
- R01 CA112023/CA/NCI NIH HHS/United States
- R0I HL080244/HL/NHLBI NIH HHS/United States
- RC1 DK086629/DK/NIDDK NIH HHS/United States
- R01 HL090842/HL/NHLBI NIH HHS/United States
- R01 DK055758/DK/NIDDK NIH HHS/United States
LinkOut - more resources
Full Text Sources
Other Literature Sources
Molecular Biology Databases
Research Materials


