Nucleolar association and transcriptional inhibition through 5S rDNA in mammals - PubMed (original) (raw)
Nucleolar association and transcriptional inhibition through 5S rDNA in mammals
Andrew M Fedoriw et al. PLoS Genet. 2012 Jan.
Abstract
Changes in the spatial positioning of genes within the mammalian nucleus have been associated with transcriptional differences and thus have been hypothesized as a mode of regulation. In particular, the localization of genes to the nuclear and nucleolar peripheries is associated with transcriptional repression. However, the mechanistic basis, including the pertinent cis- elements, for such associations remains largely unknown. Here, we provide evidence that demonstrates a 119 bp 5S rDNA can influence nucleolar association in mammals. We found that integration of transgenes with 5S rDNA significantly increases the association of the host region with the nucleolus, and their degree of association correlates strongly with repression of a linked reporter gene. We further show that this mechanism may be functional in endogenous contexts: pseudogenes derived from 5S rDNA show biased conservation of their internal transcription factor binding sites and, in some cases, are frequently associated with the nucleolus. These results demonstrate that 5S rDNA sequence can significantly contribute to the positioning of a locus and suggest a novel, endogenous mechanism for nuclear organization in mammals.
Conflict of interest statement
The authors have declared that no competing interests exist.
Figures
Figure 1. 5S rDNA transgenes show preferential association with the nucleolus and decreased transcription of a reporter gene.
A. Schematic of 5S rRNA gene structure showing the sequence of the highly conserved A and C boxes. B. Schematic of the transgene used in this study with position of 5S rRNA sequence relative to NeoR selectable marker and Tk reporter gene. C. Summary of nucleolar associations for transgenes with 5S rDNA (Tg5S, n = 9) or empty-vector transgenes (Tg0, n = 6). D. Tk mRNA levels normalized for copy number. For (C) and (D), black bars represent averages for each category. Significance determined by two-tailed t-test. E. Copy-number normalized Tk mRNA levels (y-axis) plotted against frequency of nucleolar association.
Figure 2. TFIIIC complex association and histone modifications at 5S rDNA transgenes.
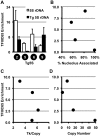
A. ChIP for the TFIIIC component, TFIIIC65, shows significant association with endogenous and transgene-5S rDNA (Tg5S rDNA). In all cases except Tg5S#5, p<0.05 (two tailed t-test), relative to the negative control, the Ascl2 promoter. Relationship between TFIIIC65 enrichment and nucleolar association (B), Tk mRNA levels (C), and Tg5S copy number (D).
Figure 3. Schematic of the transgene.
A. Schematic of the transgene showing the four regions analyzed for histone modifications, along with their base-pair position relative to the 5′ end of the transgene. We determined enrichment of H3K4me2 (B), H3K9me3 (C), H3K9me2 (D), and H3K27me3 (E) in four Tg5S lines (black circles) and two control Tg0 lines (white circles). Each heatmap illustrates the relative enrichment of that modification at each position in each line. For comparison, heatmaps of Tk mRNA levels, nucleolar localization, TFIIIC65 enrichment, and copy number for each line are shown in (F). ND, not determined.
Figure 4. Nucleolar association of a genomic region increases upon integration of 5S rDNA transgenes.
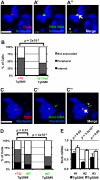
A–A″. DNA FISH in Tg5S line #9 (Tg5S#9) for transgene (red, A), and PAR (green, A′), along with IF for Nucleolin (blue). In A″, the arrowhead indicates the allele with transgene integration, the asterisk indicates the wild-type allele. B. Nucleolar association of PARs with Tg5S integration in Tg5S#9 (n = 39), and a wild-type X chromosome PAR in line Tg5S#6 (n = 61). C. DNA FISH showing Tg5S integration in the Rorb locus on chromosome 19 in Tg5S#6 (C–C″). D. Localization of Rorb alleles with (+TG, n = 82) and without (WT, n = 75) Tg5S integrations in Tg5S#6, and the cumulative localization of both alleles in a control line (Tg5S#9, n = 62). For analysis, deconvolved Z-stacks were rendered as 3-dimensional models; for illustration, each image is a Z-stack projection (see Methods Summary). Statistical significance was determined by chi-squared test. Scale bars are 2 µm. E. Rorb expression in differentiated Tg5S#6 and Tg5S#9. Each pair represents a biological replicate of retinoic-acid induced differentiation. Statistical significance was determined by t-test; _p_-values are shown above each replicate.
Figure 5. 5S rDNA pseudogenes with conserved internal binding sites are associated with the nucleolus and bound by TFIIIC.
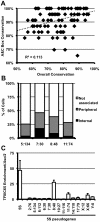
A. Conservation within the A and C boxes (y-axis) relative to overall conservation of 5S pseudogenes (x-axis) in the mouse genome. Each diamond represents a single peudogene. B. Nucleolar association of pseudogenes; pseudogenes are labeled by their location in the genome as chromosome∶megabase (5∶134, n = 59; 7∶30, n = 51; 8∶48, n = 35; 11∶74, n = 32). Single focal sections were analyzed, and scored if at least one signal was internal or peripheral to the nucleolus. C. TFIIIC65 enrichment at 5S pseudogenes in E14 ES cells. Data are represented as fold enrichment of 5S pseudogene relative to enrichment of the negative control, the Ascl2 promoter, in the TFIIIC65 ChIP.
Figure 6. Summary of localization by 5S rDNA and transgenes and model for gene regulation by 5S pseudogenes.
A. The 5S rRNA gene array (located on chromosome 8) is associated with the nucleolus in ∼40% of ES cells. B. 5S rDNA integrated at ectopic positions as transgenes are frequently associated with the nucleolar periphery (Tg5S; 5S rDNA is represented by the red line). Furthermore, integration of Tg5S increases nucleolar association of the host locus (purple line). Control vectors (Tg0) do not show this preferential association. This positioning likely depends on _trans_-factors (orange circle), potentially RNA pol III transcription factors. C. Transcription of a pol II-driven reporter gene (blue line) is reduced from Tg5S lines relative to vectors lacking the 5S rDNA sequence. The repressive effect observed in Tg5S lines strongly correlates with nucleolar association frequency. D. We observed that a subset of 5S pseudogenes (olive lines) are also associated with the nucleolus. Based on our results, we hypothesize that nucleolar association of a pseudogene would reflect a repressive effect on transcription of nearby protein coding genes (blue lines), through the same mechanism as Tg5S.
Similar articles
- Changes in 5S rDNA chromatin organization and transcription during heterochromatin establishment in Arabidopsis.
Mathieu O, Jasencakova Z, Vaillant I, Gendrel AV, Colot V, Schubert I, Tourmente S. Mathieu O, et al. Plant Cell. 2003 Dec;15(12):2929-39. doi: 10.1105/tpc.017467. Epub 2003 Nov 20. Plant Cell. 2003. PMID: 14630972 Free PMC article. - Loss of nucleolar histone chaperone NPM1 triggers rearrangement of heterochromatin and synergizes with a deficiency in DNA methyltransferase DNMT3A to drive ribosomal DNA transcription.
Holmberg Olausson K, Nistér M, Lindström MS. Holmberg Olausson K, et al. J Biol Chem. 2014 Dec 12;289(50):34601-19. doi: 10.1074/jbc.M114.569244. Epub 2014 Oct 27. J Biol Chem. 2014. PMID: 25349213 Free PMC article. - Structure and epigenetics of nucleoli in comparison with non-nucleolar compartments.
Bártová E, Horáková AH, Uhlírová R, Raska I, Galiová G, Orlova D, Kozubek S. Bártová E, et al. J Histochem Cytochem. 2010 May;58(5):391-403. doi: 10.1369/jhc.2009.955435. Epub 2009 Dec 21. J Histochem Cytochem. 2010. PMID: 20026667 Free PMC article. Review. - Chromatin: linking structure and function in the nucleolus.
McKeown PC, Shaw PJ. McKeown PC, et al. Chromosoma. 2009 Feb;118(1):11-23. doi: 10.1007/s00412-008-0184-2. Epub 2008 Oct 17. Chromosoma. 2009. PMID: 18925405 Review.
Cited by
- Concerted copy number variation balances ribosomal DNA dosage in human and mouse genomes.
Gibbons JG, Branco AT, Godinho SA, Yu S, Lemos B. Gibbons JG, et al. Proc Natl Acad Sci U S A. 2015 Feb 24;112(8):2485-90. doi: 10.1073/pnas.1416878112. Epub 2015 Jan 12. Proc Natl Acad Sci U S A. 2015. PMID: 25583482 Free PMC article. - Subnuclear relocalization and silencing of a chromosomal region by an ectopic ribosomal DNA repeat.
Jakociunas T, Domange Jordö M, Aït Mebarek M, Bünner CM, Verhein-Hansen J, Oddershede LB, Thon G. Jakociunas T, et al. Proc Natl Acad Sci U S A. 2013 Nov 19;110(47):E4465-73. doi: 10.1073/pnas.1315581110. Epub 2013 Nov 4. Proc Natl Acad Sci U S A. 2013. PMID: 24191010 Free PMC article. - The regulatory landscape of interacting RNA and protein pools in cellular homeostasis and cancer.
Gallardo-Dodd CJ, Kutter C. Gallardo-Dodd CJ, et al. Hum Genomics. 2024 Sep 27;18(1):109. doi: 10.1186/s40246-024-00678-6. Hum Genomics. 2024. PMID: 39334294 Free PMC article. Review. - Pre-Ribosomal RNA Processing in Human Cells: From Mechanisms to Congenital Diseases.
Aubert M, O'Donohue MF, Lebaron S, Gleizes PE. Aubert M, et al. Biomolecules. 2018 Oct 24;8(4):123. doi: 10.3390/biom8040123. Biomolecules. 2018. PMID: 30356013 Free PMC article. Review. - Distinct features of nucleolus-associated domains in mouse embryonic stem cells.
Bizhanova A, Yan A, Yu J, Zhu LJ, Kaufman PD. Bizhanova A, et al. Chromosoma. 2020 Jun;129(2):121-139. doi: 10.1007/s00412-020-00734-9. Epub 2020 Mar 26. Chromosoma. 2020. PMID: 32219510 Free PMC article.
References
- Misteli T. Beyond the Sequence: Cellular Organization of Genome Function. Cell. 2007;128:787–800. - PubMed
- Hakimi MA, Bochar DA, Schmiesing JA, Dong Y, Barak OG, et al. A chromatin remodelling complex that loads cohesin onto human chromosomes. Nature. 2002;418:994–998. - PubMed
- Allen TA, Von Kaenel S, Goodrich JA, Kugel JF. The SINE-encoded mouse B2 RNA represses mRNA transcription in response to heat shock. Nat Struct Mol Biol. 2004;11:816–821. - PubMed
- Lunyak VV, Prefontaine GG, Nunez E, Cramer T, Ju BG, et al. Developmentally regulated activation of a SINE B2 repeat as a domain boundary in organogenesis. Science. 2007;317:248–251. - PubMed
Publication types
MeSH terms
Substances
Grants and funding
- R01 HD036655/HD/NICHD NIH HHS/United States
- R01-HD036655/HD/NICHD NIH HHS/United States
- R01-HD2446/HD/NICHD NIH HHS/United States
- 5T32CA09156/CA/NCI NIH HHS/United States
- F32 HD052413/HD/NICHD NIH HHS/United States
- T32 CA009156/CA/NCI NIH HHS/United States
- 1F32HD052413/HD/NICHD NIH HHS/United States
- R01 GM101974/GM/NIGMS NIH HHS/United States
LinkOut - more resources
Full Text Sources


