Amyloid precursor protein and proinflammatory changes are regulated in brain and adipose tissue in a murine model of high fat diet-induced obesity - PubMed (original) (raw)
Amyloid precursor protein and proinflammatory changes are regulated in brain and adipose tissue in a murine model of high fat diet-induced obesity
Kendra L Puig et al. PLoS One. 2012.
Abstract
Background: Middle age obesity is recognized as a risk factor for Alzheimer's disease (AD) although a mechanistic linkage remains unclear. Based upon the fact that obese adipose tissue and AD brains are both areas of proinflammatory change, a possible common event is chronic inflammation. Since an autosomal dominant form of AD is associated with mutations in the gene coding for the ubiquitously expressed transmembrane protein, amyloid precursor protein (APP) and recent evidence demonstrates increased APP levels in adipose tissue during obesity it is feasible that APP serves some function in both disease conditions.
Methodology/principal findings: To determine whether diet-induced obesity produced proinflammatory changes and altered APP expression in brain versus adipose tissue, 6 week old C57BL6/J mice were maintained on a control or high fat diet for 22 weeks. Protein levels and cell-specific APP expression along with markers of inflammation and immune cell activation were compared between hippocampus, abdominal subcutaneous fat and visceral pericardial fat. APP stimulation-dependent changes in macrophage and adipocyte culture phenotype were examined for comparison to the in vivo changes.
Conclusions/significance: Adipose tissue and brain from high fat diet fed animals demonstrated increased TNF-α and microglial and macrophage activation. Both brains and adipose tissue also had elevated APP levels localizing to neurons and macrophage/adipocytes, respectively. APP agonist antibody stimulation of macrophage cultures increased specific cytokine secretion with no obvious effects on adipocyte culture phenotype. These data support the hypothesis that high fat diet-dependent obesity results in concomitant pro-inflammatory changes in brain and adipose tissue that is characterized, in part, by increased levels of APP that may be contributing specifically to inflammatory changes that occur.
Conflict of interest statement
Competing Interests: The authors have declared that no competing interests exist.
Figures
Figure 1. Average weight gain per week for mice fed a high fat versus control diet.
C57BL6/J mice at 6 weeks of age and weight matched were fed, ad libitum, a control (5.5% fat/weight) or high fat (21.2% fat/weight) diet for 22 weeks. 12 animals in each group were weighed weekly and mean (+/−SD) weight gain per group was graphed versus time. *p = 0.001.
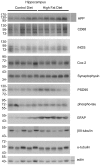
Figure 2. APP and GFAP protein levels were increased in hippocampi of high fat versus control diet fed mice.
C57BL6/J mice at 6 weeks of age and weight matched were fed, ad libitum, a control (5.5% fat/weight) or high fat (21.2% fat/weight) diet for 22 weeks. Hippocampus samples were collected from 5 animals for each diet. Comparable age hippocampi from APP-/- mice were collected as negative controls for antibody specificity. The tissue was lysed, resolved by 10–15% SDS-PAGE and Western blotted using anti-synaptophysin, PSD95, APP, iNOS, Cox-2, GFAP, phospho-tau (PHF-1), CD68, βIII tubulin (neuronal loading control), α-tubulin and actin (general loading control) antibodies. Arrowheads indicate bands of interest when nonspecific bands are present. Antibody binding was visualized by chemiluminescence. Blots from all animals in each diet are shown.
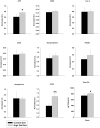
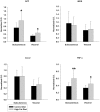
Figure 3. APP and GFAP protein and total prostaglandin levels were increased in the hippocampi of high fat versus control diet fed mice.
Optical densities of the Western blotted hippocampal proteins (APP, CD68, iNOS, Cox-2, GFAP, synaptophysin, PSD95, and phospho-tau) from the control and high fat diet Western blots were normalized against their respective averaged O.D. values of combined α-tubulin + βIII tubulin + actin loading controls (+/−SD) from 5 animals for each diet. Total brain PG levels were quantitated as a sum of PGE2, PGD2, _6-keto_PGF1α, PGF2α, and thromboxane B2 in each diet group. *p<0.05 and **p<0.01.
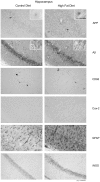
Figure 4. Hippocampi of high fat diet fed mice demonstrated microglial (CD68), astrocytic (GFAP), and neuronal (Cox-2, APP and iNOS) immunoreactivity versus control diet mice.
C57BL6/J mice at 6 weeks of age and weight matched were fed, ad libitum, a control (5.5% fat/weight) or high fat (21.2% fat/weight) diet for 22 weeks. Tissue samples were collected, fixed in 4% paraformaldehyde, serially sectioned, and immunostained. Tissue sections were immunostained using anti-APP, Aβ, GFAP, CD68, Cox-2, and iNOS antibodies and antibody binding was visualized using Vector VIP as the chromagen. Arrows indicate the location of APP immunoreactivity shown as an enlarged inset in upper right corner of each panel. Representative images from 12 animals per condition are shown.
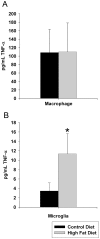
Figure 5. Microglia but not peritoneal macrophage demonstrated increased TNF-α secretion.
C57BL6/J mice at 6 weeks of age and weight matched were fed, ad libitum, a control (5.5% fat/weight) or high fat (21.2% fat/weight) diet for 22 weeks. Microglia were isolated from brains for comparison to non-elicited peritoneal macrophage. Isolated microglia or macrophage from control and high fat diet fed mice were plated overnight in serum free DMEM/F12 media and secreted TNF-α levels were quantified by commercial ELISA. Data is the average (+/−SD) of 12 animals/condition. *p<0.05.
Figure 6. APP and TNF-α levels increased in visceral and subcutaneous fat depots in high fat diet fed animals versus controls.
C57BL6/J mice at 6 weeks of age and weight matched were fed, ad libitum, a control (5.5% fat/weight) or high fat (21.2% fat/weight) diet for 22 weeks. Pericardial visceral (v) and abdominal subcutaneous (s) fat were collected from 12 animals per group. The tissue was lysed, resolved by 10-15% SDS-PAGE and Western blotted using anti-APP, iNOS, Cox-2, TNF-α, and GAPDH (loading control) antibodies. Arrowheads indicate bands of interest when nonspecific bands are present. Antibody binding was visualized by chemiluminescence. A representative blot of three animals per condition from a total of 12/condition analyzed is shown.
Figure 7. APP and TNF-α protein levels increased in subcutaneous abdominal and visceral pericardial fat in high versus control diet fed mice.
Optical densities of the adipose protein Western blots from the control and high fat diet subcutaneous and visceral samples were normalized against their respective GAPDH loading controls and averaged (+/− SD) from 12 animals per each condition. *p<0.05, **p<0.01.
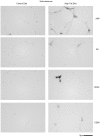
Figure 8. APP, CD45, and CD68 immunoreactivity increased in the subcutaneous (abdominal) fat from high fat versus control diet fed mice with no robust change in Aβ immunoreactivity.
C57BL6/J mice at 6 weeks of age and weight matched were fed, ad libitum, a control (5.5% fat/weight) or high fat (21.2% fat/weight) diet for 22 weeks. Subcutaneous abdominal adipose tissue was collected, immersion fixed in 4% paraformaldehyde, sectioned, and immunostained using anti-APP, Aβ, CD45 and CD68 antibodies and antibody binding visualized using Vector VIP as the chromogen. Representative images from 12 animals per condition are shown.
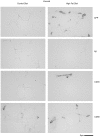
Figure 9. APP, CD45, and CD68 immunoreactivity increased in the visceral (pericardial) fat from high fat versus control diet fed mice with no robust change in Aβ immunoreactivity.
C57BL6/J mice at 6 weeks of age and weight matched were fed, ad libitum, a control (5.5% fat/weight) or high fat (21.2% fat/weight) diet for 22 weeks. Visceral pericardial adipose tissue was collected, immersion fixed, sectioned, and immunostained using anti-APP, Aβ, CD45 and CD68 antibodies and antibody binding visualized using Vector VIP as the chromogen. Representative images from 12 animals per condition are shown.
Figure 10. APP and CD68 immunoreactivity co-localized in subcutaneous (abdominal) and visceral (heart) fat from high fat diet fed mice.
C57BL6/J mice at 6 weeks of age and weight matched were fed, ad libitum, a control (5.5% fat/weight) or high fat (21.2% fat/weight) diet for 22 weeks. Subcutaneous abdominal and visceral pericardial adipose tissue samples were collected, immersion fixed, serially sectioned and immunostained using anti-CD68 antibody and binding visualized using DAB as the chromogen. For double-labeling, tissue sections were stripped using 0.2N HCl and subsequently immunostained using anti-APP antibody and binding visualized using Vector VIP as the chromogen. A representative image from 12 animals per condition is shown. The brown arrow indicates CD68 immunoreactivity, the red arrow indicates APP immunoreactivity and the black arrow indicates double-label of CD68 and APP antibody binding.
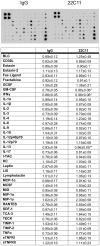
Figure 11. Secreted levels of GM-CSF, IFNγ, and IL-13 increased in media from peritoneal macrophage stimulated with APP agonist antibody, 22C11, compared to IgG1 isotype control.
Non-elicited peritoneal macrophage were stimulated with 1 µg/mL IgG1 or 1 µg/mL 22C11 APP agonist antibody overnight and the media was removed and used according in a commercial antibody-based 40 cytokine antibody array. A representative dot blot per each condition is shown. The optical densities of individual cytokine detection spots were normalized against their respective positive controls per blot and averaged (+/−SD) and graphed from 5 animals in each group. Data were analyzed via unpaired two-tailed t-test. *p<0.05, **p<0.01.
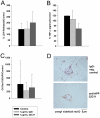
Figure 12. APP activation with agonist antibody did not alter cytokine secretion, viability, or Oil Red O staining of primary murine abdominal subcutaneous adipocytes.
Adipocytes were harvested from subcutaneous abdominal fat from C57BL6/J mice and cultured in DMEM/F12 with serum and antibiotics for one week. Cells were then placed into serum free DMEM/F12 and unstimulated (control) or stimulated for 24 hr with 1 µg/mL IgG1 (isotype control) or 1µg/mL 22C11 (APP agonist antibody). After 24 hours (A) Secreted LDH released into the media normalized against cellular LDH was quantified to assess changes in cell viability upon APP stimulation. (B) Changes in secreted TNFα levels were also quantified from the media as a result of APP stimulation. (C) Cells were also fixed, stained with Oil Red O and DAPI counterstain and changes in Oil Red O absorbance (510 nm) normalized to DAPI absorbance (358/461 nm) were quantified via plate reader. (D) Representative images of Oil Red O and cresyl violet counterstained adipocytes are shown following 24 hr IgG1 and 22C11 stimulation. Data are shown as mean (+/−SD) and are representative of three independent experiments. Data were analyzed via a one-way ANOVA.
Similar articles
- Amyloid precursor protein expression is upregulated in adipocytes in obesity.
Lee YH, Tharp WG, Maple RL, Nair S, Permana PA, Pratley RE. Lee YH, et al. Obesity (Silver Spring). 2008 Jul;16(7):1493-500. doi: 10.1038/oby.2008.267. Epub 2008 May 15. Obesity (Silver Spring). 2008. PMID: 18483477 - Mutant amyloid precursor protein differentially alters adipose biology under obesogenic and non-obesogenic conditions.
Freeman LR, Zhang L, Dasuri K, Fernandez-Kim SO, Bruce-Keller AJ, Keller JN. Freeman LR, et al. PLoS One. 2012;7(8):e43193. doi: 10.1371/journal.pone.0043193. Epub 2012 Aug 17. PLoS One. 2012. PMID: 22912823 Free PMC article. - IRX5 regulates adipocyte amyloid precursor protein and mitochondrial respiration in obesity.
Bjune JI, Haugen C, Gudbrandsen O, Nordbø OP, Nielsen HJ, Våge V, Njølstad PR, Sagen JV, Dankel SN, Mellgren G. Bjune JI, et al. Int J Obes (Lond). 2019 Nov;43(11):2151-2162. doi: 10.1038/s41366-018-0275-y. Epub 2018 Dec 11. Int J Obes (Lond). 2019. PMID: 30538277 Free PMC article. - Role of microbiota-derived lipopolysaccharide in adipose tissue inflammation, adipocyte size and pyroptosis during obesity.
Hersoug LG, Møller P, Loft S. Hersoug LG, et al. Nutr Res Rev. 2018 Dec;31(2):153-163. doi: 10.1017/S0954422417000269. Epub 2018 Jan 24. Nutr Res Rev. 2018. PMID: 29362018 Review. - The effects of insulin and insulin-like growth factor I on amyloid precursor protein phosphorylation in in vitro and in vivo models of Alzheimer's disease.
Kim B, Elzinga SE, Henn RE, McGinley LM, Feldman EL. Kim B, et al. Neurobiol Dis. 2019 Dec;132:104541. doi: 10.1016/j.nbd.2019.104541. Epub 2019 Jul 23. Neurobiol Dis. 2019. PMID: 31349033 Free PMC article. Review.
Cited by
- Exploiting Common Aspects of Obesity and Alzheimer's Disease.
Tabassum S, Misrani A, Yang L. Tabassum S, et al. Front Hum Neurosci. 2020 Dec 15;14:602360. doi: 10.3389/fnhum.2020.602360. eCollection 2020. Front Hum Neurosci. 2020. PMID: 33384592 Free PMC article. Review. - Functional recreation of age-related CD8 T cells in young mice identifies drivers of aging- and human-specific tissue pathology.
Panwar A, Jhun M, Rentsendorj A, Mardiros A, Cordner R, Birch K, Yeager N, Duvall G, Golchian D, Koronyo-Hamaoui M, Cohen RM, Ley E, Black KL, Wheeler CJ. Panwar A, et al. Mech Ageing Dev. 2020 Oct;191:111351. doi: 10.1016/j.mad.2020.111351. Epub 2020 Sep 8. Mech Ageing Dev. 2020. PMID: 32910956 Free PMC article. - Role of amyloid β in the induction of lipolysis and secretion of adipokines from human adipose tissue.
Wan Z, Mah D, Simtchouk S, Kluftinger A, Little JP. Wan Z, et al. Adipocyte. 2014 Dec 31;4(3):212-6. doi: 10.4161/21623945.2014.985020. eCollection 2015 Jul-Sep. Adipocyte. 2014. PMID: 26257989 Free PMC article. - Contributing Factors to Diabetic Brain Injury and Cognitive Decline.
Verma N, Despa F. Verma N, et al. Diabetes Metab J. 2019 Oct;43(5):560-567. doi: 10.4093/dmj.2019.0153. Diabetes Metab J. 2019. PMID: 31694078 Free PMC article. Review. - The amyloid precursor protein: a converging point in Alzheimer's disease.
Delport A, Hewer R. Delport A, et al. Mol Neurobiol. 2022 Jul;59(7):4501-4516. doi: 10.1007/s12035-022-02863-x. Epub 2022 May 17. Mol Neurobiol. 2022. PMID: 35579846 Review.
References
- Kivipelto M, Ngandu T, Fratiglioni L, Viitanen M, Kareholt I, et al. Obesity and vascular risk factors at midlife and the risk of dementia and Alzheimer disease. Archives of Neurology. 2005;62:1556–1560. - PubMed
- Whitmer RA. The epidemiology of adiposity and dementia. Current Alzheimer research. 2007;4:117–122. - PubMed
- Whitmer RA, Gunderson EP, Quesenberry CP, Zhou J, Yaffe K. Body mass index in midlife and risk of Alzheimer disease and vascular dementia. Current Alzheimer research. 2007;4:103–109. - PubMed
Publication types
MeSH terms
Substances
LinkOut - more resources
Full Text Sources
Molecular Biology Databases

