Partitioning the genetic diversity of a virus family: approach and evaluation through a case study of picornaviruses - PubMed (original) (raw)
Partitioning the genetic diversity of a virus family: approach and evaluation through a case study of picornaviruses
Chris Lauber et al. J Virol. 2012 Apr.
Abstract
The recent advent of genome sequences as the only source available to classify many newly discovered viruses challenges the development of virus taxonomy by expert virologists who traditionally rely on extensive virus characterization. In this proof-of-principle study, we address this issue by presenting a computational approach (DEmARC) to classify viruses of a family into groups at hierarchical levels using a sole criterion-intervirus genetic divergence. To quantify genetic divergence, we used pairwise evolutionary distances (PEDs) estimated by maximum likelihood inference on a multiple alignment of family-wide conserved proteins. PEDs were calculated for all virus pairs, and the resulting distribution was modeled via a mixture of probability density functions. The model enables the quantitative inference of regions of distance discontinuity in the family-wide PED distribution, which define the levels of hierarchy. For each level, a limit on genetic divergence, below which two viruses join the same group, was objectively selected among a set of candidates by minimizing violations of intragroup PEDs to the limit. In a case study, we applied the procedure to hundreds of genome sequences of picornaviruses and extensively evaluated it by modulating four key parameters. It was found that the genetics-based classification largely tolerates variations in virus sampling and multiple alignment construction but is affected by the choice of protein and the measure of genetic divergence. In an accompanying paper (C. Lauber and A. E. Gorbalenya, J. Virol. 86:3905-3915, 2012), we analyze the substantial insight gained with the genetics-based classification approach by comparing it with the expert-based picornavirus taxonomy.
Figures
Fig 1
Grouping viruses based on thresholds in the distribution of pairwise genetic divergence. Shown is a fictitious example involving eight viruses that illustrates the relation between the selection of a threshold in the distribution of intervirus genetic divergence and the accompanied change in virus grouping. (A to D) An undirected graph representation is used to show viruses (black dots), virus groups (gray ovals), and pairwise genetic divergence between viruses of the same group (colored lines). Groups are defined as connected components of the graph which are formed by connecting those virus pairs (blue edges) whose divergence does not exceed a given threshold. Some intragroup divergence values may exceed the threshold (violations; purple edges). (E to H) The same data as on top, now shown as a frequency distribution (histogram) of genetic divergence between all virus pairs with four different divergence thresholds (dashed vertical line). Intragroup divergence values obeying a threshold are shown in blue, and those violating it are shown in purple. Intergroup divergence is in white. (A and E) A trivial clustering in which the number of virus groups equals the number of viruses. No pairwise divergence values are utilized. (D and H) The second trivial clustering in which all viruses join a single virus group. All pairwise divergence values are utilized. (B and F) A nontrivial clustering consisting of three virus groups for which eight intragroup divergence values obey the threshold and three violate it. (C and G) Another nontrivial clustering consisting of two virus groups for which only a single intragroup divergence value violates the threshold. Typically, the choice of a threshold is subjective in current practice. In this study, we show (see Materials and Methods) that the violating divergence values (F and G) can be used to define a cost for an applied divergence threshold, and we apply this measure to rank thresholds. Accordingly, thresholds resulting in a lower cost are favored, which makes the clustering in C superior to that in B. This simplified example illustrates how a classification at a single level is derived (the trivial solutions in A and D are not considered). As detailed in Materials and Methods, the approach outlined above can be separately applied to multiple divergence thresholds (each at a different location in the distribution), which would result in a hierarchical classification of the viruses.
Fig 2
Optimal bin number for the picornavirus-wide pairwise distance distribution. Shown is the χ_2_ goodness-of-fit measure for approximating the picornavirus-wide PED distribution with normal probability densities using different bin sizes. Ten to 1,000 bins were tested, and the measure was normalized to a common scale of (0, 1). In the main analysis, a bin size of 0.01 (gray line) was used, which resulted in a significant fit with a χ_2_ of 7.38 under a critical value of 117.0 with n − p − 1 = 155 degrees of freedom, α = 0.01.
Fig 3
Corrected versus uncorrected picornavirus-wide pairwise distances. Plotted is corrected pairwise evolutionary distance (PED) versus pairwise uncorrected distance (PUD) for the M-2010 data set. For intermediate and large distances, a saturation of PUD values is observed, as they do not account for the total amount of evolutionary work happened, e.g., for multiple substitutions at the same sequence position. Points on the dashed line (diagonal) have equal PED and PUD values.
Fig 4
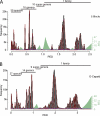
Picornavirus-wide pairwise distance distribution and distance thresholds for partitioning. (A) Frequency distribution of ∼760,000 PED values is shown for the M-2010 data set. In a first stage (see inset), peaks in the distribution were approximated using a mixture of normal distributions (red curves) together with an estimation of noise (purple horizontal line), with a goodness-of-fit of 0.972 (see Materials and Methods). For discrete distances along the distance range, TSM values (green bins) are shown. This measure is proportional to the probability of a particular distance not to be originated from one of the peak distributions. Consecutive distances with high TSM values provide candidate regions of distance discontinuity which can be used for partitioning the distribution and to infer levels of the hierarchical classification. In a second stage (B to D, top), distance threshold candidates within each region of discontinuity were probed in order to identify the threshold that minimizes the cumulative disagreement, the clustering cost (CC), of the potential clusters to the threshold. The change in the number of inferred clusters during this optimization is shown (B to D, bottom). The PED with the highest TSM score may differ from that with optimal CC (dashed vertical lines and arrows in blue). For the four top-ranked thresholds (including the trivial one at maximum distance), the number of inferred clusters is indicated above the black horizontal bars in A. The bars delimit respective intragroup distance ranges. The pairwise distance scale reflects the estimated number of amino acid substitutions per site on average.
Fig 5
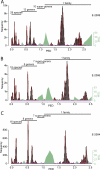
Impact of weakly conserved alignment regions and selection of capsid proteins on the GENETIC classification. Frequency distributions of ∼760,000 PED values formed by 1,234 picornaviruses are shown for the following evaluation data sets: a data set containing only highly conserved alignment regions (blocks) of the main data set (A), and a data set containing only the three capsid proteins 1B, 1C, and 1D (B). The goodness-of-fit values are 0.987 and 0.992, respectively. For details see Materials and Methods and Fig. 4.
Fig 6
Reproducibility of the GENETIC classification on the species level, part one. Frequency distributions of PED values are shown for supergenera G1 to G5 of the main data set (A to E) or a combination of three supergenera (F). PED values were compiled based on alignments covering all cluster-wide conserved domains (Table 1). Viruses currently not recognized by the ICTV are marked with asterisks. (E) An alternative threshold is indicated which would result in four instead of three species clusters (dashed line and names). The goodness of fit is in the range from 0.751 to 0.965. For details, see Materials and Methods and Fig. 4.
Fig 7
Reproducibility of the GENETIC classification on the species level, part two. Frequency distributions of PED values are shown for supergenera G6 to G9 of the main data set (A to D) or a combination of five supergenera (E). PED values were compiled based on alignments covering all cluster-wide conserved domains (Table 1). Viruses currently not recognized by the ICTV are marked with asterisks. (D) No fitting of probability densities could be obtained due to an insufficient number of sequences (n = 9). The goodness of fit is in the range from 0.751 to 0.965. For details, see Materials and Methods and Fig. 4.
Fig 8
Impact of virus sampling on the GENETIC classification. Frequency distributions of PED values are shown for evaluation data sets formed by picornaviruses sampled until 2 years (A), 4 years (B), and 6 years (C) ago with respect to the sampling time of the main data set. The goodness-of-fit values are 0.973, 0.978, and 0.953, respectively. For details, see Materials and Methods and Fig. 4.
Fig 9
Impact of alignment construction and incorporation of PASC elements into the DEmARC framework on the GENETIC classification. Frequency distributions of ∼760,000 PED or PUD values formed by 1,234 picornaviruses are shown for the following evaluation data sets: PEDs were calculated using the main data set that was automatically realigned without manual intervention using Muscle (A) and ClustalW (B), PUDs were calculated using the main data set (C), and PASC-based genome-wide PUDs were calculated (D). The goodness-of-fit values are 0.982, 0.993, 0.865, and 0.956, respectively. For details, see Materials and Methods and Fig. 4.
Fig 10
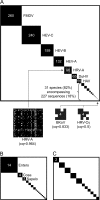
Sampling size of taxa and completeness of species in the GENETIC classification. (A) Shown is a binary square matrix of 1,234 viruses derived from the M-2010 PED matrix. Virus pairs whose PED does not exceed the species distance threshold are shown as black dots that form 38 species-specific squares along the matrix diagonal; other pairs are in white. Viruses along both coordinates are grouped by species, and species are ordered by descending virus sampling size. Note that no black dots are observed outside the squares, which is expected in classifications by SLC. For the most-populated clusters, their names and the number of sampled sequences are shown. Zoom-ins and quality values (cq) which are <1 are provided in brackets for three species for which some PEDs (depicted as empty spaces within black squares) exceeded the threshold (incomplete clusters). For all other clusters, the cq value was 1. (B) Shown is a binary square matrix of 38 species that form 16 genus-specific squares along the matrix diagonal. Species pairs from the same genus are in black, others in white. Species along both coordinates are grouped by genus, and genera are ordered by descending species sampling size. All genera are shown as if they were complete, despite the fact that the cluster formed by Enterovirus has a cq of only 0.9998. For the most-populated clusters, their identity and the number of sampled species are indicated. (C) Shown is a binary square matrix of 16 genera that form 11 supergenus-specific squares along the matrix diagonal. Genus pairs from the same supergenus are in black, others in white. Genera along both coordinates are grouped by supergenus, and supergenera are ordered by descending genus sampling size. All supergenera are shown as if they were complete, despite the fact that the cluster formed by Enterovirus/Sapelovirus has a cq of only 0.9975. The number of sampled genera is indicated for the largest cluster.
Similar articles
- Toward genetics-based virus taxonomy: comparative analysis of a genetics-based classification and the taxonomy of picornaviruses.
Lauber C, Gorbalenya AE. Lauber C, et al. J Virol. 2012 Apr;86(7):3905-15. doi: 10.1128/JVI.07174-11. Epub 2012 Jan 25. J Virol. 2012. PMID: 22278238 Free PMC article. - Avian picornaviruses: molecular evolution, genome diversity and unusual genome features of a rapidly expanding group of viruses in birds.
Boros Á, Pankovics P, Reuter G. Boros Á, et al. Infect Genet Evol. 2014 Dec;28:151-66. doi: 10.1016/j.meegid.2014.09.027. Epub 2014 Sep 30. Infect Genet Evol. 2014. PMID: 25278047 Review. - Genetics-based classification of filoviruses calls for expanded sampling of genomic sequences.
Lauber C, Gorbalenya AE. Lauber C, et al. Viruses. 2012 Sep;4(9):1425-37. doi: 10.3390/v4091425. Epub 2012 Aug 31. Viruses. 2012. PMID: 23170166 Free PMC article. - Evolutionary and taxonomic implications of conserved structural motifs between picornaviruses and insect picorna-like viruses.
Liljas L, Tate J, Lin T, Christian P, Johnson JE. Liljas L, et al. Arch Virol. 2002;147(1):59-84. doi: 10.1007/s705-002-8303-1. Arch Virol. 2002. PMID: 11855636 - Picornaviridae-the ever-growing virus family.
Zell R. Zell R. Arch Virol. 2018 Feb;163(2):299-317. doi: 10.1007/s00705-017-3614-8. Epub 2017 Oct 20. Arch Virol. 2018. PMID: 29058149 Review.
Cited by
- Rapid taxonomic categorization of short, abundant virus sequences for ecological analyses.
Sjodin AR, Willig MR, Rodríguez-Durán A, Anthony SJ. Sjodin AR, et al. Ecol Evol. 2024 Jun 17;14(6):e11501. doi: 10.1002/ece3.11501. eCollection 2024 Jun. Ecol Evol. 2024. PMID: 38895563 Free PMC article. - Deep mining of the Sequence Read Archive reveals major genetic innovations in coronaviruses and other nidoviruses of aquatic vertebrates.
Lauber C, Zhang X, Vaas J, Klingler F, Mutz P, Dubin A, Pietschmann T, Roth O, Neuman BW, Gorbalenya AE, Bartenschlager R, Seitz S. Lauber C, et al. PLoS Pathog. 2024 Apr 22;20(4):e1012163. doi: 10.1371/journal.ppat.1012163. eCollection 2024 Apr. PLoS Pathog. 2024. PMID: 38648214 Free PMC article. - The Remarkable Evolutionary Plasticity of Coronaviruses by Mutation and Recombination: Insights for the COVID-19 Pandemic and the Future Evolutionary Paths of SARS-CoV-2.
Amoutzias GD, Nikolaidis M, Tryfonopoulou E, Chlichlia K, Markoulatos P, Oliver SG. Amoutzias GD, et al. Viruses. 2022 Jan 2;14(1):78. doi: 10.3390/v14010078. Viruses. 2022. PMID: 35062282 Free PMC article. Review. - Translating genomic exploration of the family Polyomaviridae into confident human polyomavirus detection.
Kamminga S, Sidorov IA, Tadesse M, van der Meijden E, de Brouwer C, Zaaijer HL, Feltkamp MCW, Gorbalenya AE. Kamminga S, et al. iScience. 2021 Dec 11;25(1):103613. doi: 10.1016/j.isci.2021.103613. eCollection 2022 Jan 21. iScience. 2021. PMID: 35036862 Free PMC article. - A k-mer based approach for classifying viruses without taxonomy identifies viral associations in human autism and plant microbiomes.
Garcia BJ, Simha R, Garvin M, Furches A, Jones P, Gazolla JGFM, Hyatt PD, Schadt CW, Pelletier D, Jacobson D. Garcia BJ, et al. Comput Struct Biotechnol J. 2021 Oct 25;19:5911-5919. doi: 10.1016/j.csbj.2021.10.029. eCollection 2021. Comput Struct Biotechnol J. 2021. PMID: 34849195 Free PMC article.
References
- Adams MJ, et al. 2004. The new plant virus family Flexiviridae and assessment of molecular criteria for species demarcation. Arch. Virol. 149:1045–1060 - PubMed
- Adams MJ, Antoniw JF, Fauquet CM. 2005. Molecular criteria for genus and species discrimination within the family Potyviridae. Arch. Virol. 150:459–479 - PubMed
- Ando T, Noel JS, Fankhauser RL. 2000. Genetic classification of “Norwalk-like viruses.” J. Infect. Dis. 181:S336–S348 - PubMed
- Antonov IV, Leontovich AM, Gorbalenya AE. 2008. BAGG - Blocks Accepting Gaps Generator, version 1.0. http://www.genebee.msu.su/∼antonov/bagg/cgi/bagg.cgi
Publication types
MeSH terms
LinkOut - more resources
Full Text Sources
Other Literature Sources


