Toward genetics-based virus taxonomy: comparative analysis of a genetics-based classification and the taxonomy of picornaviruses - PubMed (original) (raw)
Comparative Study
. 2012 Apr;86(7):3905-15.
doi: 10.1128/JVI.07174-11. Epub 2012 Jan 25.
Affiliations
- PMID: 22278238
- PMCID: PMC3302533
- DOI: 10.1128/JVI.07174-11
Comparative Study
Toward genetics-based virus taxonomy: comparative analysis of a genetics-based classification and the taxonomy of picornaviruses
Chris Lauber et al. J Virol. 2012 Apr.
Abstract
Virus taxonomy has received little attention from the research community despite its broad relevance. In an accompanying paper (C. Lauber and A. E. Gorbalenya, J. Virol. 86:3890-3904, 2012), we have introduced a quantitative approach to hierarchically classify viruses of a family using pairwise evolutionary distances (PEDs) as a measure of genetic divergence. When applied to the six most conserved proteins of the Picornaviridae, it clustered 1,234 genome sequences in groups at three hierarchical levels (to which we refer as the "GENETIC classification"). In this study, we compare the GENETIC classification with the expert-based picornavirus taxonomy and outline differences in the underlying frameworks regarding the relation of virus groups and genetic diversity that represent, respectively, the structure and content of a classification. To facilitate the analysis, we introduce two novel diagrams. The first connects the genetic diversity of taxa to both the PED distribution and the phylogeny of picornaviruses. The second depicts a classification and the accommodated genetic diversity in a standardized manner. Generally, we found striking agreement between the two classifications on species and genus taxa. A few disagreements concern the species Human rhinovirus A and Human rhinovirus C and the genus Aphthovirus, which were split in the GENETIC classification. Furthermore, we propose a new supergenus level and universal, level-specific PED thresholds, not reached yet by many taxa. Since the species threshold is approached mostly by taxa with large sampling sizes and those infecting multiple hosts, it may represent an upper limit on divergence, beyond which homologous recombination in the six most conserved genes between two picornaviruses might not give viable progeny.
Figures
Fig 1
Picornavirus genome organization. The organization of the picornavirus genome is shown on the example of Porcine sapelovirus. Products derived after cleavage of the encoded polyprotein are indicated by rectangles and names. They include structural proteins (dark gray background) forming virus particles, nonstructural/accessory proteins (light gray) involved in replication and expression, and the leader protein (white), which is not found in all picornaviruses. The horizontal bars below highlight the six proteins conserved across the family. A concatenated, picornavirus-wide multiple alignment of these six proteins forms the data set of this study.
Fig 2
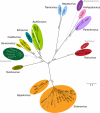
Phylogeny and GENETIC classification of the Picornaviridae. Shown is a maximum likelihood phylogeny of 38 picornaviruses representing species diversity based on the family-wide conserved proteins 1B, 1C, 1D, 2C, 3C, and 3D. A Bayesian analysis resulted in an identical tree topology (data not shown). The part of the tree representing the ICTV-defined 28 species and 12 genera is drawn in black, and provisional or currently not recognized taxa are in gray. Clusters equivalent to ICTV genera are highlighted by colored ovals. A split of Aphthovirus according to the GENETIC classification is indicated (white line). Genera with identical coloring unite to in total 11 supergenera identified in this study. The viruses shown represent the following species (italics) or species-like clusters according to the GENETIC classification: Porcine sapelovirus (PSV), Simian sapelovirus (SiSV), Avian sapelovirus (AvSV), Human rhinovirus A (HRV-A), human rhinovirus Aβ (HRV-Aβ), Human rhinovirus B (HRV-B), human rhinovirus Cα (HRV-Cα), human rhinovirus Cβ (HRV-Cβ), human rhinovirus Cγ (HRV-Cγ), Human enterovirus A (HEV-A), Human enterovirus B (HEV-B), Human enterovirus C (HEV-C), Human enterovirus D (HEV-D), Simian enterovirus A (SiEV-A), Simian enterovirus B (SiEV-B), Porcine enterovirus B (PEV-B), Bovine enterovirus (BEV), Bovine kobuvirus (BKoV), Aichi virus (AiV), Salivirus A (SaliV-A), Human parechovirus (HPeV), Ljungan virus (LjV), Duck hepatitis A virus (DuHV), Aquamavirus A (AqV-A), Hepatitis A virus (HAV), Avian encephalomyelitis virus (AvEMV), Foot-and-mouth disease virus (FMDV), Bovine rhinitis B virus (BRBV), Equine rhinitis A virus (ERAV), Equine rhinitis B virus (ERBV), Theilovirus (TMEV), Encephalomyocarditis virus (EMCV), Seneca Valley virus (SVV), human cosavirus A (CosaV-A), human cosavirus B (CosaV-B), human cosavirus D (CosaV-D), human cosavirus E (CosaV-E), Porcine teschovirus (PTeV). Numbers at branch points provide support values from 1,000 nonparametric bootstraps. The scale bar represents 0.5 amino acid substitutions per site on average.
Fig 3
Intragroup genetic divergence and species sampling size. (A) Box-and-whisker graphs were used to plot distributions of distances between viruses from the same species (orange), between viruses from different species but the same genus (blue), and between viruses from different genera but the same supergenus (purple). The boxes span from the first to the third quartile and include the median (bold line), and the whiskers (dashed lines) extend to the extreme values. For name abbreviations, see the Fig. 2 legend; numbers in brackets correspond to the number of sequences per species; open and filled diamonds indicate single and multiple host species range, respectively. Genera and supergenera constituting only one species are not shown. The corresponding first half of the PED distribution (see reference 43) is depicted below. Phylogenetic relationships of the 38 picornavirus species are shown by the cladogram to the left (following the topology in Fig. 2) with intragenus relations collapsed. Colored shapes indicate those taxa that contribute to intragroup distances to the right. Species and genera currently not recognized by ICTV are marked with asterisks, and discrepancies between the ICTV taxonomy and the GENETIC classification (not caused by recently discovered viruses) are highlighted in red. (B) The relationship between sampling size and maximum intragroup genetic divergence is shown for each species.
Fig 4
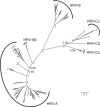
Phylogeny of rhinoviruses. Shown is an ML phylogeny for 140 rhinoviruses based on the family-wide conserved proteins 1B, 1C, 1D, 2C, 3C, and 3D. SH-like support values are shown for basal branching events. Species taxa recognized by the GENETIC classification are indicated (see also the Fig. 2 legend). A minimal set of viruses sufficient to explain all violating PEDs that exceed the species distance threshold are highlighted by gray dots (see Table 2 for details on involved viruses). The scale bar represents 0.1 amino acid substitutions per site on average.
Fig 5
Taxonomy diagram and comparison of classification frameworks. Shown is a taxonomy diagram for a classification under the ICTV framework (A) and under the DEmARC framework (B). For simplicity, the GENETIC classification is visualized in both cases and supergenera are omitted for ICTV. Intervirus genetic divergence (as PED) increases linearly (arrow) from the perimeter (PED of zero) toward the center of the circle (maximum PED of 2.78). Applied distance thresholds are shown as black dots and the delimited taxa as rectangle-like shapes. Taxa are filled using the coloring scheme from Fig. 3; the three basic colors represent the species (orange), genus (blue), and supergenus (purple) levels. Each color exists in two shadings that highlight the limit on intragroup genetic divergence according to a distance threshold (soft shading) and the maximum observed intragroup genetic divergence (bright shading) of a taxon. Outside the circle, the relative density of virus sampling per species is shown as gray shadings from low (light) to high (dark) sampling, which is in the range of 1 (least sampled species) to 260 (most sampled species). For simplicity, species identities are indicated via a binary system where the first number and the second number represent the genus and the species, respectively, as defined in the common legend below the circles. (A) ICTV treats each genus independently (different heights of genus shapes) and species must conform to genus-specific distance thresholds (equal heights of species shapes only within the same genus). (B) In the DEmARC framework, taxa are treated equally at each level and they must conform to family-wide distance thresholds (equal, level-specific heights of taxon shapes). The space inside taxon shapes colored in soft shading highlights the genetic diversity that may be missed by the current picornavirus sampling, when assuming a universal, level-wide threshold that limits the actual diversity of each taxon.
Similar articles
- Partitioning the genetic diversity of a virus family: approach and evaluation through a case study of picornaviruses.
Lauber C, Gorbalenya AE. Lauber C, et al. J Virol. 2012 Apr;86(7):3890-904. doi: 10.1128/JVI.07173-11. Epub 2012 Jan 25. J Virol. 2012. PMID: 22278230 Free PMC article. - Avian picornaviruses: molecular evolution, genome diversity and unusual genome features of a rapidly expanding group of viruses in birds.
Boros Á, Pankovics P, Reuter G. Boros Á, et al. Infect Genet Evol. 2014 Dec;28:151-66. doi: 10.1016/j.meegid.2014.09.027. Epub 2014 Sep 30. Infect Genet Evol. 2014. PMID: 25278047 Review. - Chickens host diverse picornaviruses originated from potential interspecies transmission with recombination.
Lau SKP, Woo PCY, Yip CCY, Li KSM, Fan RYY, Bai R, Huang Y, Chan KH, Yuen KY. Lau SKP, et al. J Gen Virol. 2014 Sep;95(Pt 9):1929-1944. doi: 10.1099/vir.0.066597-0. Epub 2014 Jun 6. J Gen Virol. 2014. PMID: 24906980 - Virus isolate from carp: genetic characterization reveals a novel picornavirus with two aphthovirus 2A-like sequences.
Lange J, Groth M, Fichtner D, Granzow H, Keller B, Walther M, Platzer M, Sauerbrei A, Zell R. Lange J, et al. J Gen Virol. 2014 Jan;95(Pt 1):80-90. doi: 10.1099/vir.0.058172-0. J Gen Virol. 2014. PMID: 24337965 - Picornaviridae-the ever-growing virus family.
Zell R. Zell R. Arch Virol. 2018 Feb;163(2):299-317. doi: 10.1007/s00705-017-3614-8. Epub 2017 Oct 20. Arch Virol. 2018. PMID: 29058149 Review.
Cited by
- Four principles to establish a universal virus taxonomy.
Simmonds P, Adriaenssens EM, Zerbini FM, Abrescia NGA, Aiewsakun P, Alfenas-Zerbini P, Bao Y, Barylski J, Drosten C, Duffy S, Duprex WP, Dutilh BE, Elena SF, García ML, Junglen S, Katzourakis A, Koonin EV, Krupovic M, Kuhn JH, Lambert AJ, Lefkowitz EJ, Łobocka M, Lood C, Mahony J, Meier-Kolthoff JP, Mushegian AR, Oksanen HM, Poranen MM, Reyes-Muñoz A, Robertson DL, Roux S, Rubino L, Sabanadzovic S, Siddell S, Skern T, Smith DB, Sullivan MB, Suzuki N, Turner D, Van Doorslaer K, Vandamme AM, Varsani A, Vasilakis N. Simmonds P, et al. PLoS Biol. 2023 Feb 13;21(2):e3001922. doi: 10.1371/journal.pbio.3001922. eCollection 2023 Feb. PLoS Biol. 2023. PMID: 36780432 Free PMC article. - Molecular mechanism of antibody neutralization of coxsackievirus A16.
Zhang C, Liu C, Shi J, Wang Y, Xu C, Ye X, Liu Q, Li X, Qiao W, Yin Y, Cong Y, Huang Z. Zhang C, et al. Nat Commun. 2022 Dec 21;13(1):7854. doi: 10.1038/s41467-022-35575-w. Nat Commun. 2022. PMID: 36543790 Free PMC article. - Jingchuvirales: a New Taxonomical Framework for a Rapidly Expanding Order of Unusual Monjiviricete Viruses Broadly Distributed among Arthropod Subphyla.
Di Paola N, Dheilly NM, Junglen S, Paraskevopoulou S, Postler TS, Shi M, Kuhn JH. Di Paola N, et al. Appl Environ Microbiol. 2022 Mar 22;88(6):e0195421. doi: 10.1128/AEM.01954-21. Epub 2022 Feb 2. Appl Environ Microbiol. 2022. PMID: 35108077 Free PMC article. Review. - Recognizing species as a new focus of virus research.
Gorbalenya AE, Siddell SG. Gorbalenya AE, et al. PLoS Pathog. 2021 Mar 4;17(3):e1009318. doi: 10.1371/journal.ppat.1009318. eCollection 2021 Mar. PLoS Pathog. 2021. PMID: 33662033 Free PMC article. - Enteroviruses from Humans and Great Apes in the Republic of Congo: Recombination within Enterovirus C Serotypes.
Amona I, Medkour H, Akiana J, Davoust B, Tall ML, Grimaldier C, Gazin C, Zandotti C, Levasseur A, Scola B, Raoult D, Fenollar F, Banga-Mboko H, Mediannikov O. Amona I, et al. Microorganisms. 2020 Nov 13;8(11):1779. doi: 10.3390/microorganisms8111779. Microorganisms. 2020. PMID: 33202777 Free PMC article.
References
- Beckner M. 1959. The biological way of thought. Columbia University Press, New York, NY
- Belalov IS, Isaeva OV, Lukashev AN. 2011. Recombination in hepatitis A virus: evidence for reproductive isolation of genotypes. J. Gen. Virol. 92:860–872 - PubMed
Publication types
MeSH terms
LinkOut - more resources
Full Text Sources


