SMARCAL1 catalyzes fork regression and Holliday junction migration to maintain genome stability during DNA replication - PubMed (original) (raw)
SMARCAL1 catalyzes fork regression and Holliday junction migration to maintain genome stability during DNA replication
Rémy Bétous et al. Genes Dev. 2012.
Abstract
SMARCAL1 (SWI/SNF-related, matrix-associated, actin-dependent regulator of chromatin, subfamily A-like1) maintains genome integrity during DNA replication. Here we investigated its mechanism of action. We found that SMARCAL1 travels with elongating replication forks, and its absence leads to MUS81-dependent double-strand break formation. Binding to specific nucleic acid substrates activates SMARCAL1 activity in a reaction that requires its HARP2 (Hep-A-related protein 2) domain. Homology modeling indicates that the HARP domain is similar in structure to the DNA-binding domain of the PUR proteins. Limited proteolysis, small-angle X-ray scattering, and functional assays indicate that the core enzymatic unit consists of the HARP2 and ATPase domains that fold into a stable structure. Surprisingly, SMARCAL1 is capable of binding three-way and four-way Holliday junctions and model replication forks that lack a designed ssDNA region. Furthermore, SMARCAL1 remodels these DNA substrates by promoting branch migration and fork regression. SMARCAL1 mutations that cause Schimke immunoosseous dysplasia or that inactivate the HARP2 domain abrogate these activities. These results suggest that SMARCAL1 continuously surveys replication forks for damage. If damage is present, it remodels the fork to promote repair and restart. Failures in the process lead to activation of an alternative repair mechanism that depends on MUS81-catalyzed cleavage of the damaged fork.
Figures
Figure 1.
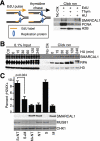
SMARCAL1 acts at replication forks to prevent MUS81-catalyzed double-strand breaks. (A) Cells were labeled with EdU for 10 min, the EdU was removed, and thymidine was added for 20 min or HU was added for 3 h prior to purifying the nascent DNA–protein complexes using the iPOND procedure. (B) EdU-labeled cells were treated with 2 mM HU for the indicated lengths of time prior to performing iPOND. The “No Clk” controls in A and B are samples treated with EdU only, but no biotin-azide was added during the click reaction. (C) U2OS cells were transfected with siRNAs targeting SMARCAL1 (S), MUS81 (M), or nontargeting (NT) as indicated. Three days after transfection, the cells were either stained with antibodies to γH2AX or harvested for immunoblotting with the indicated antibodies. The percentage of cells staining positive for γH2AX was determined by immunofluorescent imaging from three independent experiments. Cells with >10 foci were counted as positive. Error bars are the standard deviation (SD; n = 3).
Figure 2.
Characterization of the DNA-binding and DNA-stimulated ATPase activities of full-length SMARCAL1. (A,D,G,J) Increasing amounts of SMARCAL1 were incubated with the indicated oligonucleotide substrates prior to polyacrylamide gel electrophoresis. The control (Ctl) in D is an unhybridized single-stranded oligonucleotide. (B,E,H,K) Quantitation of a representative DNA-binding experiment. (C,F,I,L) Increasing amounts of DNA substrate were added to SMARCAL1, and ATPase activity was measured as the percentage of ATP hydrolyzed. Error bars represent the mean ± SD from three independent experiments. In cases in which no error bars are visible, the SD is smaller than the symbol size. The sequences of the oligonucleotides are listed in Supplemental Table 1, and a description of which oligonucleotides were used in each experiment is presented in Supplemental Table 2.
Figure 3.
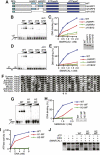
The SMARCAL1 N terminus containing the HARP domains is necessary for DNA-binding and ATPase activity. (A) Diagram of the SMARCAL1 proteins used to identify domains required for function. Wild type (WT) in all figures is full-length SMARCAL1. (B) Overexpressed SMARCAL1 proteins were purified from HEK-293T cells and examined on an SDS-PAGE gel by immunoblotting. (C,D) Increasing amounts of purified SMARCAL1 proteins were incubated with the forked DNA substrate to measure DNA binding. (E) Increasing amounts of forked DNA were added to the SMARCAL1 fragments to measure DNA-stimulated ATPase activity. Error bars represent the mean ± SD from three independent experiments. In cases in which no error bars are visible, the SD is smaller than the symbol size. The DNA substrates corresponding to each symbol and line color are the same in D and E.
Figure 4.
The HARP2 domain of SMARCAL1 is required for annealing helicase activity. (A) Diagram of the SMARCAL1 HARP domain deletion mutants purified after overexpression in HEK-293T cells. DNA binding was measured with increasing concentrations of a forked DNA substrate (B,C) or 5-nt gap DNA substrate (D,E). (F) Sequence alignment of the HARP1 and HARP2 domains of human, mouse, Xenopus laevis, and zebrafish SMARCAL1. The arrows point to the two residues mutated in the WF mutants used in G–J. (G,H) Forked DNA binding of the wild type and SMARCAL1 HARP-WF mutants purified from baculovirus-infected insect cells. Note that the HARP1-WF mutant reproducibly shifted much of the DNA substrate into the well of the gel at higher concentrations of protein. (I) Increasing amounts of forked DNA were added to the SMARCAL1 mutants to measure DNA-stimulated ATPase activity. Error bars represent the mean ± SD from three independent experiments. In cases in which no error bars are visible, the SD is smaller than the symbol size. (J) Annealing helicase activities of SMARCAL1 wild-type and mutant proteins. The concentration of the SMARCAL1 proteins in this assay is 15 nM. The insets in C and H are immunoblots confirming that equal concentrations of SMARCAL1 proteins were used.
Figure 5.
HARP2-ATPase constitutes an active structural core domain. (A) Construct used for SAXS measurements. (B) The SAXS model constructed from HARP2 (residues 325–396, gold) and ATPase (residues 451–856, blue) homology models superimposed on the ab initio molecular envelope determined by GASBOR (gray spheres). The yellow spheres represent region 397–450 modeled in BUNCH. (C) The theoretical scattering curve (red) from the model shown in B is superimposed on the experimental SAXS data (gray circles) with a goodness of fit χ = 1.5. Coomassie-stained gel of wild-type or truncated SMARCAL1 proteins (D) used in an annealing helicase assay (E).
Figure 6.
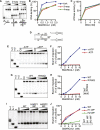
SMARCAL1 binds and branch-migrates Holliday junctions. The ability of SMARCAL1 to bind (A,B) and be activated (C) by forked, three-way, and four-way Holiday junctions was compared. The DNA substrates corresponding to each symbol and line color are the same in B and C. (D) Four-way branch migration substrate used in E–J. The 32P-labeled DNA strand (#1) for the experiments shown in E–H is indicated with an asterisk. Strand #3 was labeled for the experiment shown in I and J. (E) Increasing amounts of SMARCAL1 were incubated with the four-way branch migration substrate in the absence or presence of ATP as indicated. (G,I) Increasing amounts of wild-type (WT), R764Q, HARP1-WF, or HARP2-WF SMARCAL1 proteins were incubated with the DNA substrate in the presence of ATP. The first three lanes in E, G, and I are size standards generated by annealing the indicated oligonucleotides. The control (Ctl) samples are the annealed branch migration substrate in the absence of recombinant protein. (F,H,J) Quantitation of the reactions from E, G, and I, respectively. The amount of product in the control reactions (from spontaneous branch migration) was set at zero in each experiment, and all other samples are measured relative to the control sample. All reactions in E–J were performed for 20 min prior to termination and gel electrophoresis to characterize the products. The insets in H and J are Coomassie-stained gels confirming that equal concentrations of SMARCAL1 proteins were used.
Figure 7.
SMARCAL1 catalyzes fork regression of model replication forks. (A,B) Increasing amounts of SMARCAL1 were incubated with the indicated substrates to measure DNA binding. (C) ATPase activity of SMARCAL1 was measured in the presence of increasing amounts of leading, lagging, fork, and replication fork substrate. Symbols and line colors correspond to the same substrates as in B. Error bars represent the mean ± SD from three independent experiments. In cases in which no error bars are visible, the SD is smaller than the symbol size. (D) Diagram of the model replication fork substrates used to measure fork regression activity in E and F. A single mismatch is present at the fork junction to prevent spontaneous fork migration. The labeled strand (#1) is indicated by an asterisk. (E,F) Increasing amounts of SMARCAL1 (wild type [WT]) or R764Q SMARCAL1 were incubated with the annealed substrate for 20 min, the reaction was terminated, and products were separated by gel electrophoresis for analysis. The first three lanes in E are size standards generated by annealing the indicated oligonucleotides. The control (Ctl) sample is the annealed fork regression substrate in the absence of recombinant protein. The amount of product in the control reaction (from spontaneous regression of the model replication fork substrate) was set at zero in each experiment, and all other samples are measured relative to the control sample. The inset in F is a Coomassie-stained gel confirming that equal concentrations of SMARCAL1 proteins were used. (G) Diagram of the annealed gapped plasmid substrate used to measure SMARCAL1-catalyzed fork regression in H. The 32P-labeled DNA end is indicated with an asterisk. (H) Restriction digests with the indicated enzymes were completed following incubation of the plasmid substrate with the indicated concentrations of SMARCAL1 in the presence of ATP or ATPγS. The liberated, 32P-labeled DNA fragment was visualized on a polyacrylamide gel. The extent of fork regression was calculated as the amount of liberated fragment compared with the total radioactivity in the reaction. A representative experiment is shown.
Figure 8.
Model for how the translocase activity of the SMARCAL1 HARP2-ATPase core catalyzes fork regression. Existing structures of SNF2 translocases demonstrate that ATPase-N and ATPase-C lobes are capable of adopting different relative conformations and suggest that such conformational changes (depicted as a circular arrow) in response to the ATPase-binding and hydrolysis cycle may drive translocation along dsDNA (Durr et al. 2005; Thoma et al. 2005; Lewis et al. 2008). The SAXS model shows that the HARP2 domain in SMARCAL1 is physically associated with the ATPase-N lobe and may aid in the specialized annealing activity through ssDNA or junction binding. Translocation displaces the nascent DNA strands, induces fork regression, and promotes junction migration.
Similar articles
- Identification and characterization of SMARCAL1 protein complexes.
Bétous R, Glick GG, Zhao R, Cortez D. Bétous R, et al. PLoS One. 2013 May 9;8(5):e63149. doi: 10.1371/journal.pone.0063149. Print 2013. PLoS One. 2013. PMID: 23671665 Free PMC article. - The HIRAN domain of helicase-like transcription factor positions the DNA translocase motor to drive efficient DNA fork regression.
Chavez DA, Greer BH, Eichman BF. Chavez DA, et al. J Biol Chem. 2018 Jun 1;293(22):8484-8494. doi: 10.1074/jbc.RA118.002905. Epub 2018 Apr 11. J Biol Chem. 2018. PMID: 29643183 Free PMC article. - High-affinity DNA-binding domains of replication protein A (RPA) direct SMARCAL1-dependent replication fork remodeling.
Bhat KP, Bétous R, Cortez D. Bhat KP, et al. J Biol Chem. 2015 Feb 13;290(7):4110-7. doi: 10.1074/jbc.M114.627083. Epub 2014 Dec 31. J Biol Chem. 2015. PMID: 25552480 Free PMC article. - [SMARCAL1, roles and mechanisms in genome stability maintenance].
Wen YL, Lü KN, Xu XK, Zhang X, Ding L, Pan XF. Wen YL, et al. Yi Chuan. 2019 Dec 20;41(12):1084-1098. doi: 10.16288/j.yczz.19-158. Yi Chuan. 2019. PMID: 31857280 Review. Chinese. - The role of SMARCAL1 in replication fork stability and telomere maintenance.
Lugli N, Sotiriou SK, Halazonetis TD. Lugli N, et al. DNA Repair (Amst). 2017 Aug;56:129-134. doi: 10.1016/j.dnarep.2017.06.015. Epub 2017 Jun 10. DNA Repair (Amst). 2017. PMID: 28623093 Review.
Cited by
- A novel splice site mutation in SMARCAL1 results in aberrant exon definition in a child with Schimke immunoosseous dysplasia.
Carroll C, Hunley TE, Guo Y, Cortez D. Carroll C, et al. Am J Med Genet A. 2015 Oct;167A(10):2260-4. doi: 10.1002/ajmg.a.37146. Epub 2015 May 5. Am J Med Genet A. 2015. PMID: 25943327 Free PMC article. - Replication Termination: Containing Fork Fusion-Mediated Pathologies in Escherichia coli.
Dimude JU, Midgley-Smith SL, Stein M, Rudolph CJ. Dimude JU, et al. Genes (Basel). 2016 Jul 25;7(8):40. doi: 10.3390/genes7080040. Genes (Basel). 2016. PMID: 27463728 Free PMC article. Review. - HLTF's Ancient HIRAN Domain Binds 3' DNA Ends to Drive Replication Fork Reversal.
Kile AC, Chavez DA, Bacal J, Eldirany S, Korzhnev DM, Bezsonova I, Eichman BF, Cimprich KA. Kile AC, et al. Mol Cell. 2015 Jun 18;58(6):1090-100. doi: 10.1016/j.molcel.2015.05.013. Epub 2015 Jun 4. Mol Cell. 2015. PMID: 26051180 Free PMC article. - Co-expression network of neural-differentiation genes shows specific pattern in schizophrenia.
Maschietto M, Tahira AC, Puga R, Lima L, Mariani D, Paulsen Bda S, Belmonte-de-Abreu P, Vieira H, Krepischi AC, Carraro DM, Palha JA, Rehen S, Brentani H. Maschietto M, et al. BMC Med Genomics. 2015 May 16;8:23. doi: 10.1186/s12920-015-0098-9. BMC Med Genomics. 2015. PMID: 25981335 Free PMC article. - ATR Protects the Genome against R Loops through a MUS81-Triggered Feedback Loop.
Matos DA, Zhang JM, Ouyang J, Nguyen HD, Genois MM, Zou L. Matos DA, et al. Mol Cell. 2020 Feb 6;77(3):514-527.e4. doi: 10.1016/j.molcel.2019.10.010. Epub 2019 Nov 7. Mol Cell. 2020. PMID: 31708417 Free PMC article.
References
Publication types
MeSH terms
Substances
Grants and funding
- P30 ES000267/ES/NIEHS NIH HHS/United States
- T32 CA009582/CA/NCI NIH HHS/United States
- R01 CA136933/CA/NCI NIH HHS/United States
- P01 CA092584/CA/NCI NIH HHS/United States
- T32 ES007028/ES/NIEHS NIH HHS/United States
- T32 ES07028/ES/NIEHS NIH HHS/United States
- R01CA136933/CA/NCI NIH HHS/United States
- P01CA092584/CA/NCI NIH HHS/United States
LinkOut - more resources
Full Text Sources


