Dysfunctional pro-ceramide, ER stress, and insulin/IGF signaling networks with progression of Alzheimer's disease - PubMed (original) (raw)
Dysfunctional pro-ceramide, ER stress, and insulin/IGF signaling networks with progression of Alzheimer's disease
Suzanne M de la Monte et al. J Alzheimers Dis. 2012.
Abstract
In Alzheimer's disease (AD), brain insulin and insulin-like growth factor (IGF) resistance and deficiency begin early, and worsen with severity of disease. The factors mediating progression of brain insulin/IGF resistance in AD are not well understood. We hypothesize that AD progression is mediated via negative cross-talk that promotes toxic ceramide generation and endoplasmic reticulum (ER) stress. The rationale is that insulin resistance dysregulates lipid metabolism and promotes ceramide accumulation, and thereby increases inflammation and stress. Consequences include disruption of cytoskeletal function and AβPP-Aβ secretion. The present study correlates AD stage with activation of pro-ceramide genes, ceramide levels, and molecular indices of ER stress in postmortem human brain tissue. The results demonstrated that in AD, brain insulin/IGF resistance was associated with constitutive activation of multiple pro-ceramide genes, increased ceramide levels, and increased expression of pro-ER stress pathway genes and proteins. Expression of several pro-ceramide and pro-apoptotic ER stress pathway molecules increased with AD severity and brain insulin/IGF resistance. In contrast, ER stress molecules that help maintain homeostasis with respect to unfolded protein responses were mainly upregulated in the intermediate rather than late stage of AD. These findings support our hypothesis that in AD, a triangulated mal-signaling network initiated by brain insulin/IGF resistance is propagated by the dysregulation of ceramide and ER stress homeostasis, which themselves promote insulin resistance. Therefore, once established, this reverberating loop must be targeted using multi-pronged approaches to disrupt the AD neurodegeneration cascade.
Figures
Fig. 1
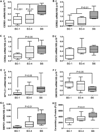
Increased pro-ceramide gene expression and ceramide levels in AD brains. RNA extracted from frontal lobes of aged controls (Braak stages 0–1), and subjects with moderate (Braak 3–4) or severe (Braak 6) AD was reverse transcribed, and the cDNAs were used in qPCR reactions. Gene expression was normalized to 18S rRNA measured in the same samples (See Methods and Table 1). Box plots depict medians (horizontal bars), 95% confidence interval limits (tops and bottoms of boxes), and range (stems) corresponding to relative levels of gene expression for (A–C) Ceramide synthases (CERS) 1, 2, 4, (D) UDP glucose ceramide glycosyltransferase (UGCG), (E) serine palmitoyl transferase subunit 1 (SPTLC), (F) GM3-synthase, (G) acid sphingomyelinase (SMPD1). (H) Ceramide immunoreactivity was measured in brain homogenates by ELISA and results were normalized to protein concentration. Inter-group comparisons were made using one-way repeated measures ANOVA with the post hoc Tukey test for significance.
Fig. 2
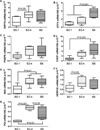
ER stress genes are upregulated in AD brains. RNA extracted from brains with normal aging (Braak 0–1), moderate AD (Braak 3–4), or severe AD (Braak 6) (n = 8/group) was reverse transcribed, and the resulting cDNAs were used in qPCR amplification reactions (See Methods and Table 1). Box plots depict medians (horizontal bars), 95% confidence interval limits (tops and bottoms of boxes), and range (stems) corresponding to relative mRNA levels of (A) GRP78, (B) ATF-4, (C) p58IPK, (D) CHOP, (E) BAX, (F) HERPUD, and (G) PDI. Inter-group comparisons were made using one-way repeated measures ANOVA with the post hoc Tukey test for significance.
Fig. 3
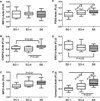
ER stress pathway activation in AD brains. ER stress proteins were measured by ELISA in brains with normal aging (Braak 0–1), moderate AD (Braak 3–4), or severe AD (Braak 6) (n = 8/group). Immunoreactivity was detected with HRP-conjugated secondary antibody and Amplex UltraRed soluble fluorophore. Results were normalized to β-actin immunoreactivity measured in the same samples. The ratios of phosphorylated/total PERK or eIF2-α were calculated. Box plots depict medians (horizontal bars), 95% confidence interval limits (tops and bottoms of boxes), and range (stems) for (A) PERK, (B) p-PERK (Thr980), (C) pPERK/PERK ratio, (D) eIF2-α, (E) p-eIF2-α (Ser51), and (F) p-eIF2-α/eIF2-α immunoreactivity. Fluorescence light units (FLU) were measured (Ex 530 nm/Em 590 nm) in a Spectramax M5 microplate reader. Inter-group comparisons were made using one-way repeated measures ANOVA with the post hoc Tukey test for significance.
Fig. 4
Increased indices of ER stress in AD brains. Protein homogenates from aged controls (Braak 0–1), and individuals with moderate (Braak 3–4) or advanced (Braak 6) AD were used to measure immunoreactivity to (A) IRE-1, (B) CHOP, (C) GRP-78/BiP, (D) PDI, (E) ERO1, and (F) calnexin. Fluorescence light units (FLU) were measured (Ex 530 nm/Em 590 nm) in a Spectramax M5 microplate reader. Box plots depict medians (horizontal bars), 95% confidence interval limits (tops and bottoms of boxes), and range (stems). Inter-group comparisons were made using one-way repeated measures ANOVA tests with the Tukey post hoc significance test.
Similar articles
- Triangulated mal-signaling in Alzheimer's disease: roles of neurotoxic ceramides, ER stress, and insulin resistance reviewed.
de la Monte SM. de la Monte SM. J Alzheimers Dis. 2012;30 Suppl 2(0 2):S231-49. doi: 10.3233/JAD-2012-111727. J Alzheimers Dis. 2012. PMID: 22337830 Free PMC article. Review. - Contributions of brain insulin resistance and deficiency in amyloid-related neurodegeneration in Alzheimer's disease.
de la Monte SM. de la Monte SM. Drugs. 2012 Jan 1;72(1):49-66. doi: 10.2165/11597760-000000000-00000. Drugs. 2012. PMID: 22191795 Free PMC article. Review. - Insulin resistance, ceramide accumulation, and endoplasmic reticulum stress in human chronic alcohol-related liver disease.
Longato L, Ripp K, Setshedi M, Dostalek M, Akhlaghi F, Branda M, Wands JR, de la Monte SM. Longato L, et al. Oxid Med Cell Longev. 2012;2012:479348. doi: 10.1155/2012/479348. Epub 2012 Apr 22. Oxid Med Cell Longev. 2012. PMID: 22577490 Free PMC article. - Insulin resistance, ceramide accumulation and endoplasmic reticulum stress in experimental chronic alcohol-induced steatohepatitis.
Ramirez T, Longato L, Dostalek M, Tong M, Wands JR, de la Monte SM. Ramirez T, et al. Alcohol Alcohol. 2013 Jan-Feb;48(1):39-52. doi: 10.1093/alcalc/ags106. Epub 2012 Sep 20. Alcohol Alcohol. 2013. PMID: 22997409 Free PMC article. - Insulin and insulin-like growth factor expression and function deteriorate with progression of Alzheimer's disease: link to brain reductions in acetylcholine.
Rivera EJ, Goldin A, Fulmer N, Tavares R, Wands JR, de la Monte SM. Rivera EJ, et al. J Alzheimers Dis. 2005 Dec;8(3):247-68. doi: 10.3233/jad-2005-8304. J Alzheimers Dis. 2005. PMID: 16340083
Cited by
- Deciphering Brain Insulin Receptor and Insulin-Like Growth Factor 1 Receptor Signalling.
Kleinridders A. Kleinridders A. J Neuroendocrinol. 2016 Nov;28(11):10.1111/jne.12433. doi: 10.1111/jne.12433. J Neuroendocrinol. 2016. PMID: 27631195 Free PMC article. - Imaging mass spectrometry of frontal white matter lipid changes in human alcoholics.
de la Monte SM, Kay J, Yalcin EB, Kril JJ, Sheedy D, Sutherland GT. de la Monte SM, et al. Alcohol. 2018 Mar;67:51-63. doi: 10.1016/j.alcohol.2017.08.004. Epub 2017 Aug 17. Alcohol. 2018. PMID: 29425959 Free PMC article. - Relationships between diabetes and cognitive impairment.
de la Monte SM. de la Monte SM. Endocrinol Metab Clin North Am. 2014 Mar;43(1):245-67. doi: 10.1016/j.ecl.2013.09.006. Epub 2013 Dec 12. Endocrinol Metab Clin North Am. 2014. PMID: 24582101 Free PMC article. Review. - Synaptic Loss, ER Stress and Neuro-Inflammation Emerge Late in the Lateral Temporal Cortex and Associate with Progressive Tau Pathology in Alzheimer's Disease.
Buchanan H, Mackay M, Palmer K, Tothová K, Katsur M, Platt B, Koss DJ. Buchanan H, et al. Mol Neurobiol. 2020 Aug;57(8):3258-3272. doi: 10.1007/s12035-020-01950-1. Epub 2020 Jun 8. Mol Neurobiol. 2020. PMID: 32514860 Free PMC article. - Biological Function of HYOU1 in Tumors and Other Diseases.
Rao S, Oyang L, Liang J, Yi P, Han Y, Luo X, Xia L, Lin J, Tan S, Hu J, Wang H, Tang L, Pan Q, Tang Y, Zhou Y, Liao Q. Rao S, et al. Onco Targets Ther. 2021 Mar 5;14:1727-1735. doi: 10.2147/OTT.S297332. eCollection 2021. Onco Targets Ther. 2021. PMID: 33707955 Free PMC article. Review.
References
- Rivera EJ, Goldin A, Fulmer N, Tavares R, Wands JR, de la Monte SM. Insulin and insulin-like growth factor expression and function deteriorate with progression of Alzheimer’s disease: Link to brain reductions in acetyl-choline. J Alzheimers Dis. 2005;8:247–268. - PubMed
- Kao Y, Youson JH, Holmes JA, Al-Mahrouki A, Sheridan MA. Effects of insulin on lipid metabolism of larvae and metamorphosing landlocked sea lamprey, Petromyzon marinus. Gen Comp Endocrinol. 1999;114:405–414. - PubMed
Publication types
MeSH terms
Substances
Grants and funding
- AA-12908/AA/NIAAA NIH HHS/United States
- R37 AA011431/AA/NIAAA NIH HHS/United States
- AA-11431/AA/NIAAA NIH HHS/United States
- R01 AA012908/AA/NIAAA NIH HHS/United States
- R56 AA011431/AA/NIAAA NIH HHS/United States
- AA-16126/AA/NIAAA NIH HHS/United States
- R01 AA011431/AA/NIAAA NIH HHS/United States
- K24 AA016126/AA/NIAAA NIH HHS/United States
LinkOut - more resources
Full Text Sources
Medical
Research Materials


