Gene coexpression networks in human brain identify epigenetic modifications in alcohol dependence - PubMed (original) (raw)
Comparative Study
Gene coexpression networks in human brain identify epigenetic modifications in alcohol dependence
Igor Ponomarev et al. J Neurosci. 2012.
Abstract
Alcohol abuse causes widespread changes in gene expression in human brain, some of which contribute to alcohol dependence. Previous microarray studies identified individual genes as candidates for alcohol phenotypes, but efforts to generate an integrated view of molecular and cellular changes underlying alcohol addiction are lacking. Here, we applied a novel systems approach to transcriptome profiling in postmortem human brains and generated a systemic view of brain alterations associated with alcohol abuse. We identified critical cellular components and previously unrecognized epigenetic determinants of gene coexpression relationships and discovered novel markers of chromatin modifications in alcoholic brain. Higher expression levels of endogenous retroviruses and genes with high GC content in alcoholics were associated with DNA hypomethylation and increased histone H3K4 trimethylation, suggesting a critical role of epigenetic mechanisms in alcohol addiction. Analysis of cell-type-specific transcriptomes revealed remarkable consistency between molecular profiles and cellular abnormalities in alcoholic brain. Based on evidence from this study and others, we generated a systems hypothesis for the central role of chromatin modifications in alcohol dependence that integrates epigenetic regulation of gene expression with pathophysiological and neuroadaptive changes in alcoholic brain. Our results offer implications for epigenetic therapeutics in alcohol and drug addiction.
Conflict of interest statement
The authors declare no conflict of interest.
Figures
Figure 1.
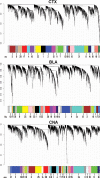
Network analysis of gene expression in three brain regions of human alcoholics and control cases identifies distinct modules of coexpressed genes. Shown are dendrograms produced by average linkage hierarchical clustering of transcripts (see Materials and Methods). Horizontal color bars represent different coexpression modules that are also numbered. Bar sizes correspond to the number of transcripts in each module.
Figure 2.
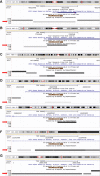
Illumina probes can detect expression of TEs in human genome. Shown are seven example panels from the UCSC Genome Browser (
) showing genomic locations that are perfect matches for several Illumina probes representing TEs. Each panel shows whole chromosome on top, with the small red bar representing the location of the Illumina probe. The next track (in blue) shows the location of a known gene, which is followed by the location of the Illumina probe (in brown). Four tracks at the bottom represent the location of known or predicted TEs, including SINE, LINE, LTR, and DNA transposons. Red arrows point to TEs to which Illumina probes map. A, Probe mapping to an LTR transposon and a 3′UTR of a known gene (IGFL3). B, Probe mapping to a SINE transposon and a 3′UTR of _RAX2_gene. C, Probe mapping to a LINE transposon and a 3′UTR of FCRL2 gene. D, Probe mapping to a DNA transposon and a 3′UTR of ZNF395 gene. E, Probe mapping to a SINE transposon and an intron of RCBTB2 gene. F, Probe mapping to an LTR transposon and an intron of TTY14 gene. G, Probe mapping to an LTR transposon and an intergenic region.
Figure 3.
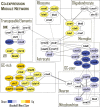
A meta-network of overlapping gene coexpression modules in human brain. Each node represents a module of coexpressed genes. Nodes are labeled with brain region and a module number. An edge between two nodes indicates a significant overlap of genes between two modules of different brain regions. Shown are only highly overlapping modules (p < 10−20). An overlap of three and more modules from different brain regions (e.g., ribosomes) indicates a cluster of highly conserved coexpression modules (represented by rectangular boxes with a dashed borderline). All overlapping modules within a cluster are overrepresented with genes from a major biological category shown in Table 1, such as neuron or TEs. In addition, several modules were clustered based on average GC content of their genes; GC-rich and GC-poor modules formed separate clusters. Several GC-poor modules were also overrepresented with “nucleus” genes. Thickness of connecting edges is proportional to the significance of the overlap. Module colors represent the direction and magnitude of regulation in alcoholic brain based on average _t_ values (see Materials and Methods) (yellow, upregulation; blue, downregulation in alcoholics; intense colors, |_t_| > 1.8; light colors, |t| > 0.9).
Figure 4.
Effects of gene GC content on gene coexpression relationships and regulation by alcohol abuse. A, ANOVA of average gene GC content (GC%) for 72 coexpression modules (labeled with brain region and module number) reveals remarkable heterogeneity among modules (F(71, 34,145) = 235; p < 10−500). B**, Average gene GC% for 72 coexpression modules plotted versus average t values. A t value represents the magnitude and direction of alcohol effects (t < 0 indicates downregulation; _t_ > 0 indicates upregulation by alcohol). Average gene GC% (C) and average GC% of Illumina probes (D**) are plotted versus average gene expression values for the 72 coexpression modules (r = Pearson's correlation; n.s., not significant).
Figure 5.
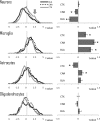
Global effects of alcohol abuse on transcriptomes of four brain cell classes. Direction and magnitude of alcohol-induced changes were estimated by plotting t distributions for genes enriched in a specific cell type (cell-type specificity was determined based on Cahoy et al., 2008; Oldham et al., 2008). A t value represents the magnitude and direction of alcohol effects (t < 0 indicates downregulation; _t_ > 0 indicates upregulation by alcohol). Left column, Average t distributions for each cell class for three brain regions. Right column, Corresponding average ± SEM t values (*p < 0.05; based on one-sample _t_ test comparing average _t_ values to zero chance with a Bonferroni's correction). Gray arrow points to a bump on cortical distribution caused by a cluster of alcohol upregulated genes (all _t_ > 2).
Figure 6.
Epigenetic modifications in alcoholic cortex. A, DNA hypomethylation is associated with higher expression of LTR retrotransposons in alcoholics. Top, Schematic diagram of three families of LTR (MLT2A1, THE1B, and LTR8). Illumina probes shown below as black bars can detect expression of these classes of LTRs and were upregulated in alcoholic brain (fold change range from 20 to 48%; p value range from 0.007 to 0.03). Arrows show locations of RT-PCR primers used for DNA methylation assays. DNA methylation shown as fold change compared with control group was measured using a combination of DNA digestion with a methylation-sensitive enzyme and qRT-PCR. B, H3K4me3 shown as fold change compared with control group is increased in alcoholics. Left panel, Global methylation of H3K4 measured using a combination of ChIP and qRT-PCR. Three right panels, H3K4me3 levels at the promoter of three hub genes from the ctx7 GC-rich module (gene symbols are italicized). *p < 0.05; **p < 0.01, as determined by a t test.
Figure 7.
A systems hypothesis for the central role of epigenetic modifications in alcohol dependence. Yellow color indicates general increase, upregulation, or activation, whereas blue color indicates general decrease, downregulation, or degeneration. Chronic alcohol causes well-documented vitamin B and folate deficiencies that negatively affect one-carbon metabolism and can result in homocysteinemia and a decreased production of SAM, the methyl group donor in most transmethylation reactions. Decreased SAM and other alcohol-mediated effects, such as acetaldehyde-induced inhibition of the maintenance DNA methyltransferase DNMT1 and 5-methylcytosine demethylation induced by the DNA damage and repair can cause global DNA hypomethylation, a chromatin state associated with many pathological conditions, including cancer. DNA hypomethylation may trigger a chain of events resulting in changes in chromatin state, such as increase in H3K4 trimethylation and activation of TCCs, which result in changes in global gene expression. Epigenome-mediated changes in transcriptome can determine cell-type-specific functional states, such as activation of microglia, neuronal degeneration in the amygdala, and neuroadaptations in the PFC. In summary, alcohol-induced epigenetically mediated changes in gene expression may underlie brain pathology and brain plasticity associated with alcohol abuse and alcohol dependence.
Comment in
- Epigenetic mechanisms: targets for treatment of alcohol dependence and drug addiction.
Rahman S. Rahman S. CNS Neurol Disord Drug Targets. 2012 Mar;11(2):101. doi: 10.2174/187152712800269696. CNS Neurol Disord Drug Targets. 2012. PMID: 22483287 No abstract available.
Similar articles
- Epigenetic control of gene expression in the alcoholic brain.
Ponomarev I. Ponomarev I. Alcohol Res. 2013;35(1):69-76. Alcohol Res. 2013. PMID: 24313166 Free PMC article. Review. - Prefrontal cortex expression of chromatin modifier genes in male WSP and WSR mice changes across ethanol dependence, withdrawal, and abstinence.
Hashimoto JG, Gavin DP, Wiren KM, Crabbe JC, Guizzetti M. Hashimoto JG, et al. Alcohol. 2017 May;60:83-94. doi: 10.1016/j.alcohol.2017.01.010. Epub 2017 Mar 14. Alcohol. 2017. PMID: 28433423 Free PMC article. - Neurobiological signatures of alcohol dependence revealed by protein profiling.
Gorini G, Roberts AJ, Mayfield RD. Gorini G, et al. PLoS One. 2013 Dec 16;8(12):e82656. doi: 10.1371/journal.pone.0082656. eCollection 2013. PLoS One. 2013. PMID: 24358215 Free PMC article. - Dysregulation of the histone demethylase KDM6B in alcohol dependence is associated with epigenetic regulation of inflammatory signaling pathways.
Johnstone AL, Andrade NS, Barbier E, Khomtchouk BB, Rienas CA, Lowe K, Van Booven DJ, Domi E, Esanov R, Vilca S, Tapocik JD, Rodriguez K, Maryanski D, Keogh MC, Meinhardt MW, Sommer WH, Heilig M, Zeier Z, Wahlestedt C. Johnstone AL, et al. Addict Biol. 2021 Jan;26(1):e12816. doi: 10.1111/adb.12816. Epub 2019 Aug 1. Addict Biol. 2021. PMID: 31373129 Free PMC article. - DNA modifications in models of alcohol use disorders.
Tulisiak CT, Harris RA, Ponomarev I. Tulisiak CT, et al. Alcohol. 2017 May;60:19-30. doi: 10.1016/j.alcohol.2016.11.004. Epub 2016 Nov 9. Alcohol. 2017. PMID: 27865607 Free PMC article. Review.
Cited by
- Unraveling the epigenomic and transcriptomic interplay during alcohol-induced anxiolysis.
Krishnan HR, Zhang H, Chen Y, Bohnsack JP, Shieh AW, Kusumo H, Drnevich J, Liu C, Grayson DR, Maienschein-Cline M, Pandey SC. Krishnan HR, et al. Mol Psychiatry. 2022 Nov;27(11):4624-4632. doi: 10.1038/s41380-022-01732-2. Epub 2022 Sep 12. Mol Psychiatry. 2022. PMID: 36089615 Free PMC article. - Epigenetic Modifications, Alcoholic Brain and Potential Drug Targets.
Jangra A, Sriram CS, Pandey S, Choubey P, Rajput P, Saroha B, Bezbaruah BK, Lahkar M. Jangra A, et al. Ann Neurosci. 2016 Oct;23(4):246-260. doi: 10.1159/000449486. Epub 2016 Oct 4. Ann Neurosci. 2016. PMID: 27780992 Free PMC article. Review. - Gene Expression Differences Between Young Adults Based on Trauma History and Post-traumatic Stress Disorder.
Bountress KE, Vladimirov V, McMichael G, Taylor ZN, Hardiman G, Chung D, Adams ZW, Danielson CK, Amstadter AB. Bountress KE, et al. Front Psychiatry. 2021 Apr 8;12:581093. doi: 10.3389/fpsyt.2021.581093. eCollection 2021. Front Psychiatry. 2021. PMID: 33897478 Free PMC article. - An Overview of Epigenetics in Obesity: The Role of Lifestyle and Therapeutic Interventions.
Mahmoud AM. Mahmoud AM. Int J Mol Sci. 2022 Jan 25;23(3):1341. doi: 10.3390/ijms23031341. Int J Mol Sci. 2022. PMID: 35163268 Free PMC article. Review. - Multi-omics signatures of alcohol use disorder in the dorsal and ventral striatum.
Zillich L, Poisel E, Frank J, Foo JC, Friske MM, Streit F, Sirignano L, Heilmann-Heimbach S, Heimbach A, Hoffmann P, Degenhardt F, Hansson AC, Bakalkin G, Nöthen MM, Rietschel M, Spanagel R, Witt SH. Zillich L, et al. Transl Psychiatry. 2022 May 6;12(1):190. doi: 10.1038/s41398-022-01959-1. Transl Psychiatry. 2022. PMID: 35523767 Free PMC article.
References
- Antony JM, van Marle G, Opii W, Butterfield DA, Mallet F, Yong VW, Wallace JL, Deacon RM, Warren K, Power C. Human endogenous retrovirus glycoprotein-mediated induction of redox reactants causes oligodendrocyte death and demyelination. Nat Neurosci. 2004;7:1088–1095. - PubMed
- Balada E, Ordi-Ros J, Vilardell-Tarrés M. Molecular mechanisms mediated by human endogenous retroviruses (HERVs) in autoimmunity. Rev Med Virol. 2009;19:273–286. - PubMed
- Benjamini Y, Hochberg Y. Controlling the false discovery rate: a practical and powerful approach to multiple testing. J R Statist Soc B. 1995;57:289–300.
- Blasco C, Caballería J, Deulofeu R, Lligoña A, Parés A, Lluis JM, Gual A, Rodés J. Prevalence and mechanisms of hyperhomocysteinemia in chronic alcoholics. Alcohol Clin Exp Res. 2005;29:1044–1048. - PubMed
Publication types
MeSH terms
Grants and funding
- U01 AA013476/AA/NIAAA NIH HHS/United States
- AA012404/AA/NIAAA NIH HHS/United States
- AA013518/AA/NIAAA NIH HHS/United States
- AA013517/AA/NIAAA NIH HHS/United States
- AA016648/AA/NIAAA NIH HHS/United States
- U01 AA013517/AA/NIAAA NIH HHS/United States
- U01 AA013518/AA/NIAAA NIH HHS/United States
- R28 AA012725/AA/NIAAA NIH HHS/United States
- AA013476/AA/NIAAA NIH HHS/United States
- U01 AA016648/AA/NIAAA NIH HHS/United States
- U01 AA020926/AA/NIAAA NIH HHS/United States
- U24 AA013517/AA/NIAAA NIH HHS/United States
- R01 AA012404/AA/NIAAA NIH HHS/United States
- K01 AA017234/AA/NIAAA NIH HHS/United States
LinkOut - more resources
Full Text Sources
Medical
Miscellaneous


