SlrA/SinR/SlrR inhibits motility gene expression upstream of a hypersensitive and hysteretic switch at the level of σ(D) in Bacillus subtilis - PubMed (original) (raw)
SlrA/SinR/SlrR inhibits motility gene expression upstream of a hypersensitive and hysteretic switch at the level of σ(D) in Bacillus subtilis
Loralyn M Cozy et al. Mol Microbiol. 2012 Mar.
Abstract
Exponentially growing Bacillus subtilis cultures are epigenetically differentiated into two subpopulations in which cells are either ON or OFF for σ(d) -dependent gene expression: a pattern suggestive of bistability. The gene encoding σ(D) , sigD, is part of the 31-gene fla/che operon where its location at the 3' end, 25 kb away from the strong P(fla/che) promoter, determines its expression level relative to a threshold. Here we show that addition of a single extra copy of the slrA gene in the chromosome inhibited σ(d) -dependent gene expression. SlrA together with SinR and SlrR reduced sigD transcript by potentiating a distance-dependent decrease in fla/che operon transcript abundance that was not mediated by changes in expression from the P(fla/che) promoter. Consistent with acting upstream of σ(D) , SlrA/SinR/SlrR was bypassed by artificial ectopic expression of sigD and hysteretically maintained for 20 generations by engaging the sigD gene at the native locus. SlrA/SinR/SlrR was also bypassed by increasing fla/che transcription and resulted in a hypersensitive output in flagellin expression. Thus, flagellin gene expression demonstrated hypersensitivity and hysteresis and we conclude that σ(d) -dependent gene expression is bistable.
© 2012 Blackwell Publishing Ltd.
Figures
Figure 1. The regulatory architecture governing σD-dependent gene expression
Block arrows represent open reading frames. Bent arrows represent promoters. Dashed line indicates fla/che operon transcript. Straight arrows represent positive genetic interaction. T-bars represent negative genetic interaction. Gray lines indicate the region of the fla/che operon that encodes genes required for the assembly of the flagellar hook basal body. To support Fig 5B, three arrows representing genes encoding the fluorophores mCherry (mcherry), CFP (cfp), and YFP (yfp) are also indicated to show how and where each reporter fits into the regulatory hierarchy.
Figure 2. SlrA inhibits σD-dependent gene expression
A) The indicated genetic backgrounds were plated on media containing the chromogenic substrate X-gal, incubated overnight at 37°C and photographed. β-galactosidase assays of Phag-lacZ transcriptional activity were conducted in the same genetic backgrounds as the colony pictures above each bar and expressed in Miller Units (Table S4). Error bars are the standard deviation of three replicates. The following strains were used to generate this panel: wild type (DS2746), swrA swrB (DS2748), swrA swrB slrA (DS9243), swrA swrB slrA (slrA+) (DS9244), (slrA+) (DS9242), (slrA+) slrA (DS7929), (slrA+) remA (DS7846), (slrA+) remB (DS7845), (slrA+) sinR (DS9331), (slrA+) slrR (DS7932). Note: an epsH mutation was introduced to the (slrA+) sinR strain in order to abolish excessive cell cohesion and permit β-galactosidase measurements. B) Map of the region surrounding slrA. Block arrows represent open reading frames. Bent arrows represent promoters. Black triangles represent the location of transposon insertion (DS3446 and DS3452) Double T-bar represents the region of DNA used for complementation of slrA, referred to as (slrA+).
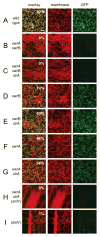
Figure 3. SlrA inhibits Phag expression in a subpopulation of swrA cells
Exponentially growing populations containing a σD-dependent reporter lacA::Phag-GFP in wild type (A, DS9294), swrA swrB (B, DS9344), swrA swrB slrA (C, DS9358), swrB (D, DS9343), swrB slrA (E, DS9357), swrA (F, DS9342), swrA slrA (G, DS9356), swrA slrA (slrA+) (H, DS9381), and (slrA+) (I, DS9334). Cells were observed using fluorescence microscopy. Membranes were false colored red and the Phag-GFP reporter was false colored green. The percentage of ON cells from greater than 600 cells counted in the population is indicated in the upper right hand corner of the overlay panels. Scale bar is 2 μm.
Figure 4. An extra copy of slrA causes severe chaining
Phase microscopy of wild type (3610) and (slrA+) (DS1578) cells during exponential growth. Scale bar is 5 μm.
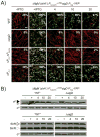
Figure 5. SlrA inhibits fla/che operon transcript levels
A) Proteins from whole cell lysates of wild type (3610), sigD (DS6420), (slrA+) (DS1578) and (slrA+) slrR (DS3113) were separated by SDS-PAGE and probed by Western blot with anti-FliG, anti-FliY, anti-σD, anti-Hag or anti-σA primary antibody and indicated by a black triangle. Open triangle indicates a non-specific cross reacting band for anti-σD. B) Three transcriptional reporters PD-3Pfla/che-mCherry (false color red), fla/cheΩCFP (false color blue), and Phag-YFP (false color green), were introduced into wild type (DS3139), (slrA+) (DS6335) and (slrA+) slrR (DS7944) as indicated by the colored arrows in Figure 1. Cells were grown to exponential phase and observed using phase and fluorescence microscopy. Scale bar is 2 μm. C) Total RNA was purified from wild type (3610, dashed line), (slrA+) (DS1578, open circles) and (slrA+) slrR (DS3113, closed circles) genetic backgrounds and used as a template for quantitative reverse transcriptase PCR. Dots on the graph represent transcript levels for (in operon order) flgB, flgC, fliE, fliF, fliG, flgE, fliK, fliY, fliZ, fliR, flhA, cheB, cheW, cheD, and sigD at the indicated distances from the Pfla/che promoter. Transcript levels were quantified using chromomsomal DNA to generate a standard curve and normalized to the expression of the sigA gene encoding the housekeeping sigma factor, σA. D) PD-3Pfla/che expression is unchanged by an extra copy of slrA in the chromosome. The indicated genetic backgrounds were used for β-galactosidase assays of PD-3Pfla/che-lacZ transcriptional activity and expressed in Miller Units (Table S5). Error bars are the standard deviation of three replicates. The following strains were used to generate this panel: wild type (DS611), (slrA+) (DS3269), ΔslrR (DS8625), (slrA+)ΔslrR (DS8626).
Figure 6. Artificially expressed σD restores σD-dependent gene expression in the presence of an extra copy of slrA
Vertical panels A and B show fluorescence microscopy of DS7228 cells containing the σD-dependent reporter Phag-YFP, the IPTG-inducible promoter fusion Physpank-sigD and the slrA complementation copy (slrA+). Vertical panels C and D show fluorescence microscopy of DS7546 cells with the same genotype as panels A and B but also includes a flgM mutation. Cells were grown to exponential phase in the absence (−) or presence (+) of 1 mM IPTG. Membrane stain was false colored red. Phag-YFP was false colored green. Scale bar is 4μm.
Figure 7. σD expression is hysteretic for activation of Phag expression
A) Fluorescence microscopy of cells containing the σD-dependent reporter Phag-YFP (false colored green) and membrane stained (false colored red). Strains were grown to OD600 0.5 in LB with or without 1 mM IPTG. Cells grown with IPTG were then pelleted, washed in LB without IPTG, and separately serially diluted to make growth back to OD600 0.5 require 4, 10 or 20 generations. The following strains were used: DS7803, DS7804, DS8243, DS8129. Common genotypes are indicated along the top of each panel with differences indicated vertically. “WT” refers to the genetic background listed above each panel series. Percent population in the σD-ON state is written in the upper right hand corner of each panel as determined by counting over 600 cells. Scale bar is 4 μm. B) Samples were taken from the hysteresis timecourse in Fig 9A of DS7803 and DS7804, whole cell lysates were separated by SDS-PAGE and probed by Western blot with anti-σD, anti-σA, and anti-SinR primary antibodies. The “−” indicates samples grown in the absence of IPTG, “+” indicates cells grown in the presence of IPTG, and numbers indicate the number of generations grown after IPTG was removed. The position of the σD protein is indicated by a black triangle. Grey triangle indicates a non-specific cross reacting band for anti-σD. The anti-SinR antibody cross-reacts with SlrR (Chu et al., 2008); the position of SlrR is indicated by an open black triangle and the position of SinR is indicated by an open gray triangle. Each series represents a separate gel using the same samples.
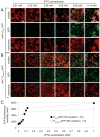
Figure 8. Activation of Phag expression is hypersensitive to induction of σD
A) Fluorescence microscopy of cells containing the σD-dependent reporter Phag-GFP (false colored green) and membrane stained (false colored red). Strain DS9345 was grown to OD600 1.0 in LB in the presence of the indicated amount of IPTG. B) Fluorescence microscopy of cells containing an IPTG inducible Physpank-GFP construct (false colored green) and membrane stained (false colored red). Strain DS5237 was grown to OD600 1.0 in LB in the presence of the indicated amount of IPTG. C) The fluorescence intensity of over 600 cells of strains DS9345 (closed circles) and DS5237 (open circles) was deteremined by pixel counting at each IPTG concentration and the median fluorescence intensity was plotted on the graph (Table S6). Hill constants were derived by fitting the data to a standard binding curve (van Holde et al., 1998).
Similar articles
- Relative roles of the fla/che P(A), P(D-3), and P(sigD) promoters in regulating motility and sigD expression in Bacillus subtilis.
West JT, Estacio W, Márquez-Magaña L. West JT, et al. J Bacteriol. 2000 Sep;182(17):4841-8. doi: 10.1128/JB.182.17.4841-4848.2000. J Bacteriol. 2000. PMID: 10940026 Free PMC article. - Characterization of the sigD transcription unit of Bacillus subtilis.
Márquez-Magaña LM, Chamberlin MJ. Márquez-Magaña LM, et al. J Bacteriol. 1994 Apr;176(8):2427-34. doi: 10.1128/jb.176.8.2427-2434.1994. J Bacteriol. 1994. PMID: 8157612 Free PMC article. - SlrR/SlrA controls the initiation of biofilm formation in Bacillus subtilis.
Kobayashi K. Kobayashi K. Mol Microbiol. 2008 Sep;69(6):1399-410. doi: 10.1111/j.1365-2958.2008.06369.x. Epub 2008 Jul 18. Mol Microbiol. 2008. PMID: 18647168 - Gene position in a long operon governs motility development in Bacillus subtilis.
Cozy LM, Kearns DB. Cozy LM, et al. Mol Microbiol. 2010 Apr;76(2):273-85. doi: 10.1111/j.1365-2958.2010.07112.x. Epub 2010 Mar 10. Mol Microbiol. 2010. PMID: 20233303 Free PMC article. - Proteases HtrA and HtrB for α-amylase secreted from Bacillus subtilis in secretion stress.
Yan S, Wu G. Yan S, et al. Cell Stress Chaperones. 2019 May;24(3):493-502. doi: 10.1007/s12192-019-00985-1. Epub 2019 Apr 18. Cell Stress Chaperones. 2019. PMID: 31001739 Free PMC article. Review.
Cited by
- Termination factor Rho: From the control of pervasive transcription to cell fate determination in Bacillus subtilis.
Bidnenko V, Nicolas P, Grylak-Mielnicka A, Delumeau O, Auger S, Aucouturier A, Guerin C, Repoila F, Bardowski J, Aymerich S, Bidnenko E. Bidnenko V, et al. PLoS Genet. 2017 Jul 19;13(7):e1006909. doi: 10.1371/journal.pgen.1006909. eCollection 2017 Jul. PLoS Genet. 2017. PMID: 28723971 Free PMC article. - Second Messenger Signaling in Bacillus subtilis: Accumulation of Cyclic di-AMP Inhibits Biofilm Formation.
Gundlach J, Rath H, Herzberg C, Mäder U, Stülke J. Gundlach J, et al. Front Microbiol. 2016 May 25;7:804. doi: 10.3389/fmicb.2016.00804. eCollection 2016. Front Microbiol. 2016. PMID: 27252699 Free PMC article. - Regulation of flagellar motility during biofilm formation.
Guttenplan SB, Kearns DB. Guttenplan SB, et al. FEMS Microbiol Rev. 2013 Nov;37(6):849-71. doi: 10.1111/1574-6976.12018. Epub 2013 Apr 12. FEMS Microbiol Rev. 2013. PMID: 23480406 Free PMC article. Review. - Functional analysis of the protein Veg, which stimulates biofilm formation in Bacillus subtilis.
Lei Y, Oshima T, Ogasawara N, Ishikawa S. Lei Y, et al. J Bacteriol. 2013 Apr;195(8):1697-705. doi: 10.1128/JB.02201-12. Epub 2013 Feb 1. J Bacteriol. 2013. PMID: 23378512 Free PMC article. - The structure and regulation of flagella in Bacillus subtilis.
Mukherjee S, Kearns DB. Mukherjee S, et al. Annu Rev Genet. 2014;48:319-40. doi: 10.1146/annurev-genet-120213-092406. Epub 2014 Sep 10. Annu Rev Genet. 2014. PMID: 25251856 Free PMC article. Review.
References
- Balaban NQ, Merrin J, Chait R, Kowalik L, Leibler S. Bacterial persistence as a phenotypic switch. Science. 2004;305:1622–1625. - PubMed
- Bertero MG, Gonzales B, Tarricone C, Ceciliani F, Galizzi A. Overproduction and characterization of the Bacillus subtilis anti-sigma factor FlgM. J Biol Chem. 1999;274:12103–12107. - PubMed
Publication types
MeSH terms
Substances
Grants and funding
- T32 GM007757/GM/NIGMS NIH HHS/United States
- R01 GM081571/GM/NIGMS NIH HHS/United States
- GM092616/GM/NIGMS NIH HHS/United States
- R01 GM093030-03/GM/NIGMS NIH HHS/United States
- R01 GM093030/GM/NIGMS NIH HHS/United States
- GM093030/GM/NIGMS NIH HHS/United States
- RC2 GM092616/GM/NIGMS NIH HHS/United States
LinkOut - more resources
Full Text Sources
Molecular Biology Databases
Miscellaneous


