A mouse model of the most aggressive subgroup of human medulloblastoma - PubMed (original) (raw)
. 2012 Feb 14;21(2):168-80.
doi: 10.1016/j.ccr.2011.12.023.
Giles Robinson, Tamar Uziel, Paul Gibson, Jerold Rehg, Cuilan Gao, David Finkelstein, Chunxu Qu, Stanley Pounds, David W Ellison, Richard J Gilbertson, Martine F Roussel
Affiliations
- PMID: 22340591
- PMCID: PMC3285412
- DOI: 10.1016/j.ccr.2011.12.023
A mouse model of the most aggressive subgroup of human medulloblastoma
Daisuke Kawauchi et al. Cancer Cell. 2012.
Abstract
Medulloblastomas that display a large cell/anaplastic morphology and overexpress the cellular c-MYC gene are highly aggressive and carry a very poor prognosis. This so-called MYC-subgroup differs in its histopathology, gene expression profile, and clinical behavior from other forms of medulloblastoma. We generated a mouse model of MYC-subgroup medulloblastoma by transducing Trp53-null cerebellar progenitor cells with Myc. The cardinal features of these mouse medulloblastomas closely mimic those of human MYC-subgroup tumors and significantly differ from mouse models of the Sonic-Hedgehog- and WNT-disease subgroups. This mouse model should significantly accelerate understanding and treatment of the most aggressive form of medulloblastoma and infers distinct roles for MYC and MYCN in tumorigenesis.
Copyright © 2012 Elsevier Inc. All rights reserved.
Figures
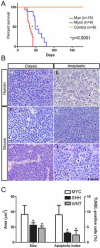
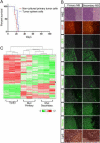
Figure 1. MBs derived from orthotopic transplants in the cortices of naïve recipient mice of cerebellar progenitors overexpressing Myc and Mycn
(A) Kaplan-Meier survival curves of mice transplanted with cerebellar cells purified from [_Cdkn2c_−/−, _Trp53_−/−, _Atoh1-GFP_] mice infected with Myc-RFP (red line), Mycn-RFP (blue line) or RFP empty vector (orange line). (B) Pathology of human and mouse MBs (H&E): (a) a human tumor with MYCN amplification and classic morphological features, and (b) a human anaplastic tumor with MYC amplification. Note the difference in nuclear pleomorphism between classic and anaplastic tumors. The anaplastic tumor also shows a paving stone-like pattern of cell molding and contains abundant apoptotic cells, a hallmark of this variant. Mycn-tumors with a classic morphology of round cells (c, e) contrast with Myc-tumors that show an anaplastic morphology with cell molding and abundant mitotic figures and apoptotic bodies (d, f). Scale bar = 50μm. (C) Myc- tumor cells are significantly larger, and are more likely to undergo apoptosis, than their SHH- and WNT-subgroups counterparts. Error bars indicate standard deviation. *, p<0.05 for SHH- and WNT-subgroup tumors compared to the MYC-subgroup. See also Figure S1.
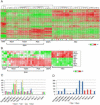
Figure 2. Comparative molecular analysis of engineered mouse MBs and GNPs
(A) Affymetrix gene chip analysis of mouse Myc- and Mycn-tumors, GNPs purified from the cerebellum of P6 [_Cdkn2c_−/−, _Trp53_−/−, _Atoh1-GFP_] mice, from spontaneous MBs of the SHH-subgroup from [_Cdkn2c_−/−, _Trp53_−/−, _Nestin-cre_] and [_Cdkn2c_−/−, Ptch1+/−] mice and from the mouse WNT-subgroup from [Ctnnb1+/lox (ex3); _Blbp-Cre; Trp53_−/−] mice. Arrowheads indicate Myc-tumors from FACS-sorted GFP-positive (GFP+) (green) and GFP-negative (GFP−) (red) cerebellar cells. (B) Heatmap of differentially regulated genes between Myc- and Mycn- mouse MBs and the SHH-subgroup MBs from the Ptch1+/− and _Trp53_-null mice, the WNT-subgroup of tumors and GNPs. (C–D) Quantitative RT-PCR (QRT-PCR) analysis of Atoh1, Gli1, Boc and Sfrp1 (C) and Myc and Mycn (D) in _Myc_-engineered MBs (Myc-1,2,3) compared to spontaneous Trp53 and Ptch MBs, Mycn-engineered (Mycn-1,2,3) MBs, and GNPs. See also Figure S2.
Figure 3. Comparison of the gene expression signature of human MYC-, SHH-, and WNT-subgroup MB with that of mouse MBs reveals three representative murine models of the human disease
Signature genes that specifically distinguish the human WNT-, SHH-, and MYC-subgroup tumors by their broad subgroup over-expression relative to the others were compiled from three recent publications on subgroups of MB (Cho et al., 2011; Northcott et al., 2011; Thompson et al., 2006). 52 signature genes relatively over-expressed by the human MYC-subgroup, 54 by the human WNT-subgroup, and 53 by the human SHH-subgroup were found to have corresponding mouse orthologs on the Affymetrix 430v2 chip. Shown here are representative heat maps columns which compare mean average expression of the orthologs in the three mouse medulloblastoma models (Myc, Shh, Wnt). Red indicates a log scale relative increase of expression while green signifies a log scale relative decrease of expression. The ortholog name and the corresponding first author of the study from which the signature gene was described are listed in the columns immediately to the right of the heat map. (A) 31 of 52 orthologs (60%) with increased expression in the human MYC-medulloblastoma subgroup and in the mouse Myc-tumors. (B) 40 of 54 orthologs (74%) with increased expression in the human WNT-subgroup and in the mouse WNT-tumors. (C) 31 of 53 orthologs (58%) with increased expression in the human SHH-subgroup and mouse Ptch-tumors. See also Figure S3.
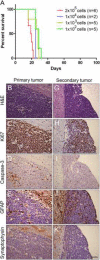
Figure 4. Mouse MYC-subgroup MBs before and after orthotopic transplants
(A) Kaplan-Meier survival curve of mice subjected to orthotopic cranial injection of decreasing number of Myc- primary tumor cells. (B–K) Sections of tumors were immunostained with H&E (B, G), Ki67, a marker of proliferating cells (C, H), cleaved Caspase-3, a marker of apoptosis (D, I), GFAP, that marks glial and neural progenitor cells (E, J), and synaptophysin that characterizes mature neurons (F, K). Scale bar = 50 μm. See also Figure S5.
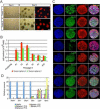
Figure 5. Myc-induced tumor cells grow as neurospheres in vitro
(A) Tumor cells from mouse MYC-subgroup MBs form red spheres by day 6 after plating. Scale bar = 200 μm. (B) Spheres can be passaged continuously, here shown up to passage 10 with the cell number increasing up to 25 fold. (C) Immunostaining of tumor spheres with antibodies against Ki67, Npr3, Nestin, Sox2, Oct4, Nanog, Lgr5 and GFAP. Scale bar = 50 μm. (D) Spheres share a similar molecular signature (lower levels of Shh signature genes and higher levels of Lgr5 and Npr3) than that of GNPs after several passages up to passage 10. Data are represented as the mean ± SD. See also Figure S6.
Figure 6. Tumor sphere cells contain tumor-propagating cells
(A) Myc-engineered MBs form after transplant of purified tumor cells or tumor sphere cells at passage 2 (2×10⁵ cells) into the cortices of recipient mice. (B) Comparison of the expression of RFP, GFP, Ki67, Npr3, Nestin, Sox2, Oct4, Nanog and Lgr5 by IHC between primary MB (Primary MB) and those induced after transplant of spheres (Secondary MB). Scale bar = 50 μm. (C) Comparison of gene signature among Trp53-tumors, Myc-primary and Myc-secondary tumors.
Figure 7. Myc- tumor cells are resistant to SHH signaling inhibitors
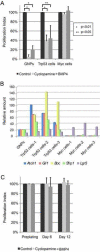
(A) GNPs purified from the cerebellum from 7 days old pups and purified tumor cells were grown in serum-free medium in the absence (Control, black square) or the presence of cyclopamine (light grey square) or BMP4 (dark grey square). Proliferation was assessed by FACS by calculating the percent of BrdU positive cells. Proliferation index was defined as the ratio of the percentage of BrdU-incorporated cells with Shh signaling antagonists to that of control. (B) GNPs and tumor cells were analyzed by qRT-PCR for specific gene expression to validate the expression of genes in the SHH signaling pathway. (C) Treatment of MYC-tumor sphere cells with or without SHH signaling antagonists under neurosphere culture conditions. Proliferation index represents the ratio of cell number of cultured neurosphere cells with SHH signaling antagonists to that of control, 6 and 12 days after plating. Data in graphs A and C represent the mean ± SD.
Comment in
- Three down and one to go: modeling medulloblastoma subgroups.
Eberhart CG. Eberhart CG. Cancer Cell. 2012 Feb 14;21(2):137-8. doi: 10.1016/j.ccr.2012.01.013. Cancer Cell. 2012. PMID: 22340583 Free PMC article.
Similar articles
- Epigenetic regulation in medulloblastoma pathogenesis revealed by genetically engineered mouse models.
Shiraishi R, Kawauchi D. Shiraishi R, et al. Cancer Sci. 2021 Aug;112(8):2948-2957. doi: 10.1111/cas.14990. Epub 2021 Jun 17. Cancer Sci. 2021. PMID: 34050694 Free PMC article. Review. - Somatic cell transfer of c-Myc and Bcl-2 induces large-cell anaplastic medulloblastomas in mice.
Jenkins NC, Rao G, Eberhart CG, Pedone CA, Dubuc AM, Fults DW. Jenkins NC, et al. J Neurooncol. 2016 Feb;126(3):415-24. doi: 10.1007/s11060-015-1985-9. Epub 2015 Oct 30. J Neurooncol. 2016. PMID: 26518543 Free PMC article. - Inhibition of WNT signaling attenuates self-renewal of SHH-subgroup medulloblastoma.
Rodriguez-Blanco J, Pednekar L, Penas C, Li B, Martin V, Long J, Lee E, Weiss WA, Rodriguez C, Mehrdad N, Nguyen DM, Ayad NG, Rai P, Capobianco AJ, Robbins DJ. Rodriguez-Blanco J, et al. Oncogene. 2017 Nov 9;36(45):6306-6314. doi: 10.1038/onc.2017.232. Epub 2017 Jul 17. Oncogene. 2017. PMID: 28714964 Free PMC article. - The miR-17/92 polycistron is up-regulated in sonic hedgehog-driven medulloblastomas and induced by N-myc in sonic hedgehog-treated cerebellar neural precursors.
Northcott PA, Fernandez-L A, Hagan JP, Ellison DW, Grajkowska W, Gillespie Y, Grundy R, Van Meter T, Rutka JT, Croce CM, Kenney AM, Taylor MD. Northcott PA, et al. Cancer Res. 2009 Apr 15;69(8):3249-55. doi: 10.1158/0008-5472.CAN-08-4710. Epub 2009 Apr 7. Cancer Res. 2009. PMID: 19351822 Free PMC article. - A Proteogenomic Approach to Understanding MYC Function in Metastatic Medulloblastoma Tumors.
Staal JA, Pei Y, Rood BR. Staal JA, et al. Int J Mol Sci. 2016 Oct 19;17(10):1744. doi: 10.3390/ijms17101744. Int J Mol Sci. 2016. PMID: 27775567 Free PMC article. Review.
Cited by
- Epigenetic regulation in medulloblastoma pathogenesis revealed by genetically engineered mouse models.
Shiraishi R, Kawauchi D. Shiraishi R, et al. Cancer Sci. 2021 Aug;112(8):2948-2957. doi: 10.1111/cas.14990. Epub 2021 Jun 17. Cancer Sci. 2021. PMID: 34050694 Free PMC article. Review. - In Vivo and Ex Vivo Pediatric Brain Tumor Models: An Overview.
Li Z, Langhans SA. Li Z, et al. Front Oncol. 2021 Apr 1;11:620831. doi: 10.3389/fonc.2021.620831. eCollection 2021. Front Oncol. 2021. PMID: 33869004 Free PMC article. Review. - Children's Oncology Group's 2013 blueprint for research: central nervous system tumors.
Gajjar A, Packer RJ, Foreman NK, Cohen K, Haas-Kogan D, Merchant TE; COG Brain Tumor Committee. Gajjar A, et al. Pediatr Blood Cancer. 2013 Jun;60(6):1022-6. doi: 10.1002/pbc.24427. Epub 2012 Dec 19. Pediatr Blood Cancer. 2013. PMID: 23255213 Free PMC article. Review. - Notch Signaling between Cerebellar Granule Cell Progenitors.
Adachi T, Miyashita S, Yamashita M, Shimoda M, Okonechnikov K, Chavez L, Kool M, Pfister SM, Inoue T, Kawauchi D, Hoshino M. Adachi T, et al. eNeuro. 2021 May 12;8(3):ENEURO.0468-20.2021. doi: 10.1523/ENEURO.0468-20.2021. Print 2021 May-Jun. eNeuro. 2021. PMID: 33762301 Free PMC article. - Chromosomal Instability Characterizes Pediatric Medulloblastoma but Is Not Tolerated in the Developing Cerebellum.
Bočkaj I, Martini TEI, Smit MJ, Armandari I, Bakker B, Wardenaar R, Meeuwsen-de Boer TGJ, Bakker PL, Spierings DCJ, Hoving EW, Guryev V, Foijer F, Bruggeman SWM. Bočkaj I, et al. Int J Mol Sci. 2022 Aug 30;23(17):9852. doi: 10.3390/ijms23179852. Int J Mol Sci. 2022. PMID: 36077248 Free PMC article.
References
- Aldosari N, Bigner SH, Burger PC, Becker L, Kepner JL, Friedman HS, McLendon RE. MYCC and MYCN oncogene amplification in medulloblastoma. A fluorescence in situ hybridization study on paraffin sections from the Children's Oncology Group. Arch Pathol Lab Med. 2002;126:540–544. - PubMed
- Barker N, van Es JH, Kuipers J, Kujala P, van den Born M, Cozijnsen M, Haegebarth A, Korving J, Begthel H, Peters PJ, Clevers H. Identification of stem cells in small intestine and colon by marker gene Lgr5. Nature. 2007;449:1003–1007. - PubMed
- Berman DM, Karhadkar SS, Hallahan AR, Pritchard JI, Eberhart CG, Watkins DN, Chen JK, Cooper MK, Taipale J, Olson JM, Beachy PA. Medulloblastoma growth inhibition by hedgehog pathway blockade. Science. 2002;297:1559–1561. - PubMed
Publication types
MeSH terms
Substances
Grants and funding
- R01 CA129541/CA/NCI NIH HHS/United States
- P01 CA096832-08/CA/NCI NIH HHS/United States
- CA-21765/CA/NCI NIH HHS/United States
- P30 CA021765/CA/NCI NIH HHS/United States
- P01 CA096832/CA/NCI NIH HHS/United States
- CA-096832/CA/NCI NIH HHS/United States
LinkOut - more resources
Full Text Sources
Other Literature Sources
Molecular Biology Databases
Research Materials
