miR-196b directly targets both HOXA9/MEIS1 oncogenes and FAS tumour suppressor in MLL-rearranged leukaemia - PubMed (original) (raw)
Hao Huang 1, Ping Chen 1, Miao He 1 2, Yuanyuan Li 1, Stephen Arnovitz 1, Xi Jiang 1, Chunjiang He 1, Elizabeth Hyjek 3, Jun Zhang 4, Zhiyu Zhang 5, Abdel Elkahloun 6, Donglin Cao 1 7, Chen Shen 1, Mark Wunderlich 8, Yungui Wang 9, Mary Beth Neilly 1, Jie Jin 9, Minjie Wei 2, Jun Lu 10, Peter J M Valk 11, Ruud Delwel 11, Bob Lowenberg 11, Michelle M Le Beau 1, James Vardiman 3, James C Mulloy 8, Nancy J Zeleznik-Le 12, Paul P Liu 6, Jiwang Zhang 4, Jianjun Chen 13
Affiliations
- PMID: 22353710
- PMCID: PMC3514459
- DOI: 10.1038/ncomms1681
miR-196b directly targets both HOXA9/MEIS1 oncogenes and FAS tumour suppressor in MLL-rearranged leukaemia
Zejuan Li et al. Nat Commun. 2012.
Erratum in
- Publisher Correction: miR-196b directly targets both HOXA9/MEIS1 oncogenes and FAS tumour suppressor in MLL-rearranged leukaemia.
Li Z, Huang H, Chen P, He M, Li Y, Arnovitz S, Jiang X, He C, Hyjek E, Zhang J, Zhang Z, Elkahloun A, Cao D, Shen C, Wunderlich M, Wang Y, Neilly MB, Jin J, Wei M, Lu J, Valk PJM, Delwel R, Lowenberg B, Le Beau MM, Vardiman J, Mulloy JC, Zeleznik-Le NJ, Liu PP, Zhang J, Chen J. Li Z, et al. Nat Commun. 2018 Apr 10;9:16192. doi: 10.1038/ncomms16192. Nat Commun. 2018. PMID: 29633759 Free PMC article.
Abstract
HOXA9 and MEIS1 have essential oncogenic roles in mixed lineage leukaemia (MLL)-rearranged leukaemia. Here we show that they are direct targets of miRNA-196b, a microRNA (miRNA) located adjacent to and co-expressed with HOXA9, in MLL-rearranged leukaemic cells. Forced expression of miR-196b significantly delays MLL-fusion-mediated leukemogenesis in primary bone marrow transplantation through suppressing Hoxa9/Meis1 expression. However, ectopic expression of miR-196b results in more aggressive leukaemic phenotypes and causes much faster leukemogenesis in secondary transplantation than MLL fusion alone, likely through the further repression of Fas expression, a proapoptotic gene downregulated in MLL-rearranged leukaemia. Overexpression of FAS significantly inhibits leukemogenesis and reverses miR-196b-mediated phenotypes. Targeting Hoxa9/Meis1 and Fas by miR-196b is probably also important for normal haematopoiesis. Thus, our results uncover a previously unappreciated miRNA-regulation mechanism by which a single miRNA may target both oncogenes and tumour suppressors, simultaneously, or, sequentially, in tumourigenesis and normal development per cell differentiation, indicating that miRNA regulation is much more complex than previously thought.
Conflict of interest statement
The authors declare no competing financial interests.
Figures
Figure 1. Co-expression of miR-196b with HOXA genes and MEIS1 in human AMLs.
(a) Schematic representation of the genomic organization of miR-196b and HOXA genes, and expression correlation between miR-196b and HOXA genes and MEIS1 in 56 de novo AML and 9 normal control samples. Expression data were mean centred. Red represents a high expression. N_, normal control; MNC, mononuclear cells; r, correlation coefficient. (b) Mixed lineage leukaemia (MLL) fusions bind to the upstream region of miR-196b (left panel) and promote its expression (right panel) in _MLL_-rearranged AML cells as detected by quantitative PCR (qPCR). (c,d) Expression of miR-196b, HOXA9 and MEIS1 was upregulated in human CD34+ umbilical cord blood cells after retroviral transduction of MLL-AF9 (MA9) at different time points (W, week), but not in those transduced with AML1-ETO (AE) or CBFB-MYH11 (CM) (c), and in mouse BM Lin− progenitor cells transduced with MLL-AF9 in colony-forming/replating assays (d). The stand errors (s.e.) were based on two independent qPCR assays, and in each qPCR assay we had triplicates for each sample/reaction.
Figure 2. HOXA9 and MEIS1 are direct targets of miR-196b.
(a) Predicted target sites and relevant mutation sequences. (b,c) Luciferase reporter/mutagenesis assay (left panel) and western blotting (right panel) indicate that HOXA9 and MEIS1 are repressed by miR-196b in both Hela (b) and MONOMAC6 leukaemic (c) cells. Increase in luciferase activity upon inhibition of miR-196b is due to inhibition of the endogenous expression of miR-196b. The NC (that is, negative control) for miRNA overexpression (using MSCV-miRNA) is the empty vector (that is, MSCV). miR-20a is a negative-control miRNA (for miR-196b overexpression) that consumes the same Dicer machinery in cells as miR-196b, but is predicted not to bind to the 3′ UTR of either HOXA9 or MEIS1. The NC for miR-196b hairpin inhibitor is hairpin inhibitor negative control (that is, scrambled oligos). *P<0.05, two-tailed _t_-test of three independent experiments. (d) Schematic representation of HOXA9 or MEIS1 mRNA, highlighted with alternative polyadenylation sites and putative miR-196b targeting sites in 3′ UTR. Grey boxes show protein-coding (CDS) regions. Average expression levels of different probes of HOXA9 or MEIS1 in 15 _MLL_-rearranged AML and 9 normal controls as detected by Affymetrix Human Exon 1.0 ST array analysis were shown. (e) Schematic illustration of three pairs of qPCR primers to analyse expression of CDS and 3′ UTR of HOXA9. Then, qPCR analysis of CDS and 3′ UTR region of HOXA9 in 35 leukaemia and 11 normal control samples was shown. Mean±s.e. values are shown.
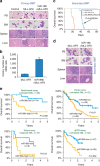
Figure 3. Forced expression of miR-196b significantly delays leukemogenesis in primary transplantation.
(a) Kaplan–Meier survival analysis of the mice. n, mouse number. (b) Flow cytometric analysis of bone marrow (BM), peripheral blood (PB), spleen and liver of representative mice. M, myeloid cells; B, B cells; T, T cells. (c) Engraftment degrees (that is, GFP+ cell proportions) of different cohorts of transplanted mice at 4 weeks post transplantation or at the terminal stage (that is, when leukaemic mice were killed, or at 200 days post transplantation for the non-leukemic mice). (d,e) The original (left panel) and adjusted (by engraftment degree; right panel) expression levels of miR-196b, Hoxa9 or Meis1 in peripheral blood (PB; d) of mice at the two stages, or in BM cells (e) at the terminal stage, relative to the expression levels in PB or BM of control mice bearing retrovirally transduced empty vectors (that is, MSCV-PIG+MIY). *P<0.05; **P<0.01; two-tailed _t_-test.
Figure 4. Overexpression of miR-196b is associated with aggressive leukaemia in mice and poor prognosis in acute myeloid leukaemia (AML) patients.
(a) Comparison of MLL-AF9 and miR-196b+MLL-AF9 primary leukaemic cells and tissues. (b) Colony-forming assay of primary leukaemic bone marrow (BM) cells. Plated 5,000 cells per dish and cultured for 7 days before count. BM cells isolated from three leukaemic mice in each group were used for the assay. **P<0.01, two-tailed _t_-test. (c) Kaplan–Meier survival analysis of the secondary transplantation mice. Mouse number. (d) Comparison of MLL-AF9 and miR-196b+MLL-AF9 secondary leukaemic cells and tissues. Peripheral blood (PB) smear and BM cell cytospin via Wright–Giemsa staining, and spleen and liver tissues via haematoxylin and eosin (H&E) staining of paraffin sections (resolution is indicated on the images) are shown. (e) Patients with increased expression of miR-196b exhibited significantly (P<0.05; log-rank test) shorter overall survival (OS) than those with decreased expression in different patient sets. Each AML patient set was dichotomized at the median value of miR-196b expression, and Kaplan–Meier curves were generated to depict outcomes. ∣, censored. The length of bars shown in (a) and (d) represents 10 μm (for PB and BM) or 50 μm (for spleen and liver tissues). BMT, bone marrow transplantation.
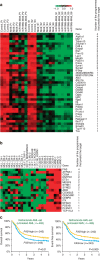
Figure 5. Candidate target genes of miR-196b.
(a) Gene expression profiles of 41 predicted target genes of miR-196b in BM cells of primary and secondary transplantation mice as detected by Affymetrix mouse gene arrays. Expression data were mean centred and the relative value for each sample is represented by a colour, with red representing a high expression and green representing a low expression (scale shown in the upper left). MA9, MLL-AF9; _P, primary transplantation recipient mouse; _S, secondary transplantation recipient mouse. (b) Seventeen out of the above 41 candidate target genes of miR-196b were also significantly (q<0.05; FDR<0.01; significance analysis of microarrays (SAM)41) downregulated in human _MLL_-rearranged leukaemia samples relative to human normal CD33+ myeloid and mononuclear cell (MNC) samples. Normal CD34+ stem/progenitor cell samples were not included in the SAM analysis. Expression data were mean centred and the relative value for each sample is represented by a colour, with red representing a high expression and green representing a low expression (scale shown in the upper left). (c) Patients with decreased expression of FAS exhibited significantly (P<0.05; log-rank test) shorter OS and event-free survival (EFS) than those with increased expression. Each acute myeloid leukaemia (AML) patient set was dichotomized at the median value of FAS expression, and Kaplan–Meier curves were generated to depict outcomes. |, censored.
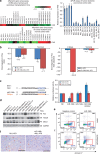
Figure 6. Fas is a direct target of miR-196b.
(a) Expression profiles of FAS/Fas by Affymetrix gene array and affymetrix exon array assays (left panel); Expression of Fas by quantitative PCR (qPCR) assay (right panel). (b) The original (left panel) and adjusted (by engraftment degree; right panel) expression levels of Fas in PB of primary BMT mice at the two stages, relative to the expression levels in PB of control mice bearing retrovirally transduced empty vectors (that is, MSCV-PIG+MIY). (c) Wild-type and mutated target site of miR-196b in 3′ UTR of FAS (left panel), and luciferase reporter and mutagenesis assays (right panel). NC, negative control. miR-148 is a control miRNA that is predicted not to target FAS. *P<0.05, two-tailed _t_-test of three independent experiments. (d) Western blotting assay of Fas, Hoxa and Meis1 in bone marrow (BM) cells of primary (P-) and secondary (S-) transplantation mice. (e) Flow cytometry analysis of anti-Fas antibody-induced apoptosis in Jurkat and MONOMAC6 cells with or without ectopic expression of miR-196b. (f) Immunohistochemical staining of paraffin-embedded secondary transplantation spleen tissues with cleaved caspase-3 antibody. The apoptotic cells are shown in brown; apoptotic cells per field in miR-196b+MLL-AF9 tissue is 6, much fewer than that (19) in MLL-AF9 tissue. The length of the bars represents 50 μm.
Figure 7. Forced expression of FAS inhibits leukemogenesis in secondary transplantation.
(a) Kaplan–Meier survival analysis of mice. MA9, MLL-AF9. (b) Comparison of miR-196b+MLL-AF9 with or without _FAS_-overexpressing secondary leukaemic cells and tissues. (c) Immunohistochemical staining of paraffin-embedded secondary transplantation spleen tissues with cleaved caspase-3 antibody. The apoptotic cells are shown in brown; apoptotic cells per field in miR-196b+MLL-AF9 tissue is 8, much fewer than that (30) in miR-196b+MLL-AF9+FAS tissue. The length of bars shown in Figure 7b,c represents 10 μm (for peripheral blood (PB) and bone marrow (BM)) or 50 μm (for spleen and liver tissues).
Figure 8. Regulation of Hoxa9/Meis1 and Fas expression by miR-196b in haematopoiesis and leukemogenesis.
(a) Relative expression levels of miR-196b, Hoxa9, Meis1 and Fas in normal haematopoietic cells (left panel) and in _MLL_-rearranged leukaemic cells (right panel). In mouse normal haematopoietic cells, their expression levels in long-term HSC (LT-HSC; Lin−Sca1+c-Kit+Flk2−, LSKF−), short-term HSC (ST-HSC; Lin−Sca1+c-Kit+Flk2+, LSKF+), committed progenitor (CP; Lin−Sca1−c-Kit+), Gr-1+/Mac-1+ myeloid and B220+ lymphoid cells, were normalized by the levels in lineage negative (Lin−) cells. In human _MLL_-rearranged leukaemic cells, their expression levels in normal CD34+ (N_CD34+) haematopoietic stem/progenitor cells, normal CD33+ (N_CD33+) myeloid cells and mononuclear cells (MNC) were normalized by the mean expression values of all the normal control samples. (b) Model of miR-196b-mediated gene regulations in normal haematopoiesis (left panel) and human _MLL_-associated leukemogensis (right panel). In haematopoiesis, miR-196b contributes to the fine tuning of expression abundance of Hoxa9 and Meis1 while repressing expression of Fas during haematopoiesis, particularly in the period of ST-HSC and committed progenitor cells; once expression of miR-196b is downregulated, expression of Fas is upregulated, which in turns promotes differentiation. In leukemogenesis, MLL fusions aberrantly upregulate expression of HOXA9, MEIS1 and miR-196b, particularly in committed progenitor cells. Although expression of HOXA9 and MEIS1 is still partially repressed by miR-196b, the residual abundance of their transcripts is adequate for cell transformation; on the other hand, expression of Fas and other tumour-suppressor target genes that are important for cell differentiation and/or apoptosis has been thoroughly inhibited by miR-196b due to the extra high level of miR-196b expression. As a result, the committed progenitor cells carrying _MLL_-fusion lose their capacity to differentiate while regaining self-renewal capacity, and thereby are transformed into leukaemia stem/initiating cells (LSC or LIC) and eventually cause leukaemia.
Similar articles
- MiR-495 is a tumor-suppressor microRNA down-regulated in MLL-rearranged leukemia.
Jiang X, Huang H, Li Z, He C, Li Y, Chen P, Gurbuxani S, Arnovitz S, Hong GM, Price C, Ren H, Kunjamma RB, Neilly MB, Salat J, Wunderlich M, Slany RK, Zhang Y, Larson RA, Le Beau MM, Mulloy JC, Rowley JD, Chen J. Jiang X, et al. Proc Natl Acad Sci U S A. 2012 Nov 20;109(47):19397-402. doi: 10.1073/pnas.1217519109. Epub 2012 Nov 6. Proc Natl Acad Sci U S A. 2012. PMID: 23132946 Free PMC article. - PBX3 and MEIS1 Cooperate in Hematopoietic Cells to Drive Acute Myeloid Leukemias Characterized by a Core Transcriptome of the MLL-Rearranged Disease.
Li Z, Chen P, Su R, Hu C, Li Y, Elkahloun AG, Zuo Z, Gurbuxani S, Arnovitz S, Weng H, Wang Y, Li S, Huang H, Neilly MB, Wang GG, Jiang X, Liu PP, Jin J, Chen J. Li Z, et al. Cancer Res. 2016 Feb 1;76(3):619-29. doi: 10.1158/0008-5472.CAN-15-1566. Epub 2016 Jan 8. Cancer Res. 2016. PMID: 26747896 Free PMC article. - Two isoforms of HOXA9 function differently but work synergistically in human MLL-rearranged leukemia.
He M, Chen P, Arnovitz S, Li Y, Huang H, Neilly MB, Wei M, Rowley JD, Chen J, Li Z. He M, et al. Blood Cells Mol Dis. 2012 Aug 15;49(2):102-6. doi: 10.1016/j.bcmd.2012.05.003. Epub 2012 May 25. Blood Cells Mol Dis. 2012. PMID: 22633751 Free PMC article. - Deregulation of the HOXA9/MEIS1 axis in acute leukemia.
Collins CT, Hess JL. Collins CT, et al. Curr Opin Hematol. 2016 Jul;23(4):354-61. doi: 10.1097/MOH.0000000000000245. Curr Opin Hematol. 2016. PMID: 27258906 Free PMC article. Review. - Molecular regulators of HOXA9 in acute myeloid leukemia.
Aryal S, Zhang Y, Wren S, Li C, Lu R. Aryal S, et al. FEBS J. 2023 Jan;290(2):321-339. doi: 10.1111/febs.16268. Epub 2021 Nov 19. FEBS J. 2023. PMID: 34743404 Review.
Cited by
- The expression and regulation of HOX genes and membrane proteins among different cytogenetic groups of acute myeloid leukemia.
Wang H, Lin SY, Hu FF, Guo AY, Hu H. Wang H, et al. Mol Genet Genomic Med. 2020 Sep;8(9):e1365. doi: 10.1002/mgg3.1365. Epub 2020 Jul 2. Mol Genet Genomic Med. 2020. PMID: 32614525 Free PMC article. - A microRNA signature for clinical outcomes of pediatric ALL patients treated with TPOG protocols.
Chang YH, Jou ST, Yen CT, Lin CY, Yu CH, Chang SK, Lu MY, Chang HH, Pai CH, Hu CY, Lin KH, Lin SR, Lin DT, Chen HY, Yang YL, Lin SW, Yu SL. Chang YH, et al. Am J Cancer Res. 2022 Oct 15;12(10):4764-4774. eCollection 2022. Am J Cancer Res. 2022. PMID: 36381326 Free PMC article. - MicroRNAs as biomarkers in leukemia.
Wang X, Zhu B, Huang Z, Chen L, He Z, Zhang H. Wang X, et al. Stem Cell Investig. 2014 May 27;1:11. doi: 10.3978/j.issn.2306-9759.2014.04.01. eCollection 2014. Stem Cell Investig. 2014. PMID: 27358857 Free PMC article. Review. - miR-196b Is Epigenetically Silenced during the Premalignant Stage of Lung Carcinogenesis.
Tellez CS, Juri DE, Do K, Picchi MA, Wang T, Liu G, Spira A, Belinsky SA. Tellez CS, et al. Cancer Res. 2016 Aug 15;76(16):4741-51. doi: 10.1158/0008-5472.CAN-15-3367. Epub 2016 Jun 14. Cancer Res. 2016. PMID: 27302168 Free PMC article. - Aberrant DNA hypomethylation of miR-196b contributes to migration and invasion of oral cancer.
Hou YY, You JJ, Yang CM, Pan HW, Chen HC, Lee JH, Lin YS, Liou HH, Liu PF, Chi CC, Ger LP, Tsai KW. Hou YY, et al. Oncol Lett. 2016 Jun;11(6):4013-4021. doi: 10.3892/ol.2016.4491. Epub 2016 Apr 25. Oncol Lett. 2016. PMID: 27313732 Free PMC article.
References
- Krivtsov A. V. & Armstrong S. A. MLL translocations, histone modifications and leukaemia stem-cell development. Nat. Rev. Cancer 7, 823–833 (2007). - PubMed
- Roth J. J., Crist R. C. & Buchberg A. M. Might as well face it: MLL's addicted to HOX. Blood 113, 2372–2373 (2009). - PubMed
Publication types
MeSH terms
Substances
Grants and funding
- R01 HL95896/HL/NHLBI NIH HHS/United States
- CA127277/CA/NCI NIH HHS/United States
- ZIC HG200365-01/Intramural NIH HHS/United States
- R01 CA127277/CA/NCI NIH HHS/United States
- HL087188/HL/NHLBI NIH HHS/United States
- R01 HL095896/HL/NHLBI NIH HHS/United States
- ZIC HG200365-02/Intramural NIH HHS/United States
- R01 CA118319/CA/NCI NIH HHS/United States
- P01 CA040046/CA/NCI NIH HHS/United States
- P30 CA014599/CA/NCI NIH HHS/United States
- ZIC HG200365-03/Intramural NIH HHS/United States
- P01 CA40046/CA/NCI NIH HHS/United States
- R01 HL087188/HL/NHLBI NIH HHS/United States
LinkOut - more resources
Full Text Sources
Other Literature Sources
Medical
Molecular Biology Databases
Research Materials
Miscellaneous


