Increased dosage of the chromosome 21 ortholog Dyrk1a promotes megakaryoblastic leukemia in a murine model of Down syndrome - PubMed (original) (raw)
. 2012 Mar;122(3):948-62.
doi: 10.1172/JCI60455. Epub 2012 Feb 22.
Affiliations
- PMID: 22354171
- PMCID: PMC3287382
- DOI: 10.1172/JCI60455
Increased dosage of the chromosome 21 ortholog Dyrk1a promotes megakaryoblastic leukemia in a murine model of Down syndrome
Sébastien Malinge et al. J Clin Invest. 2012 Mar.
Abstract
Individuals with Down syndrome (DS; also known as trisomy 21) have a markedly increased risk of leukemia in childhood but a decreased risk of solid tumors in adulthood. Acquired mutations in the transcription factor-encoding GATA1 gene are observed in nearly all individuals with DS who are born with transient myeloproliferative disorder (TMD), a clonal preleukemia, and/or who develop acute megakaryoblastic leukemia (AMKL). Individuals who do not have DS but bear germline GATA1 mutations analogous to those detected in individuals with TMD and DS-AMKL are not predisposed to leukemia. To better understand the functional contribution of trisomy 21 to leukemogenesis, we used mouse and human cell models of DS to reproduce the multistep pathogenesis of DS-AMKL and to identify chromosome 21 genes that promote megakaryoblastic leukemia in children with DS. Our results revealed that trisomy for only 33 orthologs of human chromosome 21 (Hsa21) genes was sufficient to cooperate with GATA1 mutations to initiate megakaryoblastic leukemia in vivo. Furthermore, through a functional screening of the trisomic genes, we demonstrated that DYRK1A, which encodes dual-specificity tyrosine-(Y)-phosphorylation-regulated kinase 1A, was a potent megakaryoblastic tumor-promoting gene that contributed to leukemogenesis through dysregulation of nuclear factor of activated T cells (NFAT) activation. Given that calcineurin/NFAT pathway inhibition has been implicated in the decreased tumor incidence in adults with DS, our results show that the same pathway can be both proleukemic in children and antitumorigenic in adults.
Figures
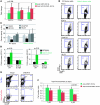
Figure 1. Ts1Rhr mice develop a progressive myeloproliferative disorder associated with thrombocytosis.
(A) Monthly platelet (PLT) counts of euploid and Ts1Rhr mice. Mean ± SD. (B) H&E staining of bone marrow and spleen sections from old Ts1Rhr mice (>12 months) and wild-type mice (original magnification, ×400). The arrowheads point to megakaryocytes. (C) Histograms showing the percentages of myeloid progenitors of 12- to 14-month-old euploid and Ts1Rhr mice. CMP, Lin–c-kit+Sca–FcγRII/III–CD34+; GMP, Lin–c-kit+Sca–FcγRII/III+CD34+; MEP, Lin–c-kit+Sca–FcγRII/III–CD34–. Percentages of live cells are indicated. Mean ± SD. (D) Twelve- to fourteen-month-old Ts1Rhr bone marrow and spleen (SP) give rise to significantly more CFU-Mk colonies. Mean ± SD. (E) Histograms representing percentages of LSK populations and the percentage of CD34hi in the LSK population. Mean ± SD. (F) Functional HSC frequency in the Ts1Rhr bone marrow (1 out of 66,182 cells) compared with that in wild-type bone marrow (1 out of 137,284 cells), assessed by competitive transplants 8 weeks after transplantation. Mean ± SD.
Figure 2. Genetic interaction between trisomy for 33 orthologs of Hsa21 and the Gata1 mutation in vivo.
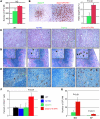
(A) CFU-Mk colony numbers from E13.5 fetal liver cells as well as (B) representative pictures (original magnification, ×100) of the CFU-Mk colonies (n = 3–4 per group) and a histogram comparing the large colonies/total colonies ratio. Mean ± SD. (C) Representative reticulin stains of bone marrow from 6-month-old mice (original magnification, ×400). (D and E) Representative spleen section images of (D) H&E (original magnification, ×100; ×400 [insets]) and (E) von Willebrand factor immunostaining (original magnification, ×400) of 6-month-old mice. The arrows point to megakaryocytes. (F) Histogram plots showing the proportion of CD41+ splenocytes at 6 months, as determined by flow cytometry. Mean percentages ± SD (n = 2–4 per group). (G) CFU-Mk colony number from bone marrow and spleen cells from the Gata1s and Gata1s/Ts1Rhr genetic backgrounds. Mean ± SD (n = 4–5 per group).
Figure 3. Three oncogenic events, including a partial trisomy 21, cooperate to promote DS-MkL in vivo.
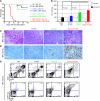
(A) Survival curves of mice transplanted with different combinations of oncogenic events (n = 6–13 per group). (B) Platelet counts of recipient mice 4 weeks after transplantation. Mean ± SD (n = 4–12 per group). (C) H&E-stained spleen sections of MPL W515L–overexpressing transplanted mice at 4 weeks after transplant (original magnification, ×400). (D) von Willebrand factor immunostaining of MPL W515L–overexpressing recipient mice 4 weeks after transplant, showing the complete megakaryocytic infiltration of the spleen only in the triple mutant mice (original magnification, ×400). (E) Representative flow cytometry plots reveal that triple mutants display marked megakaryocytic expansion in the spleen, while double or single mutants show neutrophilia. Percentages of live cells are indicated.
Figure 4. ERG, DYRK1A, CHAF1B, and HLCS are leading candidate DS leukemia-promoting oncogenes.
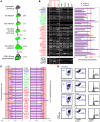
(A) Schematic representation of the strategy used to assess the functional implication of trisomic genes in human DS-AMKL cell lines. (B) RT-PCR of the DSCR and nearby genes selected for the functional screening in various cell lines, including DS-AMKL lines CMK and CMY (left panel). Red type indicates Ts1Rhr mice; green type indicates Ts1Cje mice; blue type indicates Ts65Dn mice; and black type indicates Tc1 mice. D, DMSO treated; T, TPA treated. Knockdown efficiency of the selected genes in the CMY cell lines (right panel). We hypothesize that a knockdown efficiency of at least 33% (0.66 threshold) artificially recapitulates the disomy of euploid cells. (C) Plots of normalized values of CD42 expression and DNA content of shRNA-infected CMY cells after treatment for 3 days with TPA. Changes outside of 2 SDs from the mean (red box) were considered significant. (D) Representative flow cytometry plots, showing effect of the DYRK1A, CHAF1B, and HLCS knock down during TPA-induced megakaryocytic differentiation of CMK cells. Percentages of live cells are indicated. Knockdown efficiency (KD eff) is shown. exp, expression; puro, puromycin selection.
Figure 5. DYRK1A and CHAF1B are overexpressed in DS-TMD and DS-AMKL.
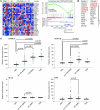
(A) GSEA of the 33 trisomic human orthologs contained in Ts1Rhr mice derived from an available gene expression profile data set (62), comparing their relative expression in non–DS-AMKL compared with that in DS-AMKL and their relative enrichment. (B) Ranked list of chromosome 21 genes of the DSCR enriched in DS-AMKL compared with those in non–DS-AMKL from both data set 1 (shown in A) and data set 2 (26). (C) DYRK1A (probe set 209033_s_at), CHAF1B (probe set 204775_s_at), HLCS (probe set 209399_s_at), and ERG (probe set 211626_s_at) relative expression in pediatric AML (n = 9), non–DS-AMKL (n = 43), DS-AMKL (n = 20), and TMD (n = 8) (GC_RMA normalized probe values extracted from ref. 26). Gene expression in each sample (individual colored symbols), medians (horizontal bars), and P values (t test) are shown.
Figure 6. Dyrk1a is a prominent megakaryocytic tumor-promoting gene.
(A) Fold change gene expression values of Dyrk1a, Chaf1b, and Hlcs, as assessed by real-time PCR, in CD41-positive cells isolated from spleens of Gata1s/Ts1Rhr/MPL W515L recipient mice, compared with those in Gata1s/MPL W515L CD41-selected spleen cells 4 weeks posttransplantation. Mean ± SD. (B) Representative flow cytometry plots depicting the proportion of CD41+ cells derived from cultures of bone marrow progenitors infected with Dyrk1a, CHAF1B, or HLCS encoding viruses or control vector. Percentages of live cells are indicated. (C) Overexpression of Dyrk1a leads to reduced polyploidization of megakaryocytes. Mean ± SD (n = 3–5 per group). *P < 0.004, **P < 0.0008 compared with control infected. (D) Fold change increase in percentage of CD41+ and CD42+ cells after expression of wild-type or kinase-inactive alleles of Dyrk1a in wild-type or Gata1s bone marrow progenitors. Mean percentages ± SD (n = 2–4 per group). (E) Representative flow cytometry plots of Dyrk1a shRNA and control infected progenitors cells cultured under megakaryocytic conditions. Bone marrow cells were derived from Ts1Rhr and Gata1s/Ts1Rhr mice. Percentages of live cells are indicated. (F) Treatment of double (Gata1s/MPL W515L) and triple (Gata1s/Ts1Rhr/MPL W515L) mutant cells with harmine reveals that trisomic cells are more sensitive to DYRK1A inhibition in vitro. Mean ± SD (n = 3–4 per group).
Figure 7. DYRK1A dosage imbalance is correlated with NFAT pathway dysregulation in human and murine primary cells.
(A) Ratio of live cells treated with serial dilution of the Harmine inhibitor at 3 days (n = 3 per group) normalized on untreated cells. Mean ± SD. (B) Representative FACS plots, showing the effect of 5 μM harmine on a 3-day TPA-induced megakaryocytic differentiation of CMY. (C) Venn diagram showing the number of common genes dysregulated between treated or infected CMK and CMY cells during TPA-induced megakaryocytic differentiation. (D and E) Representative Western blots of DYRK1A, NFATC2, phospho-NFATC2 (P-NFATC2), and NFATC4 expression (D) in CD41-enriched spleen cells from euploid mice compared with that in Ts1Rhr mice (n = 2) and (E) in Gata1s mice (n = 2) compared with that in Gata1s/Ts1Rhr mice. (F) Gata1s/Ts1Rhr/MPL W515L triple mutant cells are less sensitive to the NFAT/calcineurin inhibitor cyclosporine A (CsA) than the non-trisomic Gata1s/MPL W515L cells in liquid culture. Mean ± SD (n = 5 per group). (G) Flow cytometry analysis of CD41 and CD42 populations derived from Ts1Rhr bone marrow progenitors infected with control or DYRK1A shRNA and treated for 3 days with cyclosporine A or vehicle. Percentages of live cells are indicated.
Figure 8. Schematic representation of the multistep pathogenesis model of murine DS-MkL and phenotypes associated with the presence of the partial trisomy.
Trisomic genes associated with each step in murine (blue) and human samples (green) are indicated below. Note that DYRK1A (underlined) is the only trisomic gene overexpressed at each step in both species. Triangles represent the third hit (MPL W515L in this study). KI, knockin; T21, trisomy 21, X, GATA1 mutation.
Comment in
- DYRK1A in Down syndrome: an oncogene or tumor suppressor?
Birger Y, Izraeli S. Birger Y, et al. J Clin Invest. 2012 Mar;122(3):807-10. doi: 10.1172/JCI62372. Epub 2012 Feb 22. J Clin Invest. 2012. PMID: 22354166 Free PMC article.
Similar articles
- DYRK1A in Down syndrome: an oncogene or tumor suppressor?
Birger Y, Izraeli S. Birger Y, et al. J Clin Invest. 2012 Mar;122(3):807-10. doi: 10.1172/JCI62372. Epub 2012 Feb 22. J Clin Invest. 2012. PMID: 22354166 Free PMC article. - Mutations in GATA1 in both transient myeloproliferative disorder and acute megakaryoblastic leukemia of Down syndrome.
Greene ME, Mundschau G, Wechsler J, McDevitt M, Gamis A, Karp J, Gurbuxani S, Arceci R, Crispino JD. Greene ME, et al. Blood Cells Mol Dis. 2003 Nov-Dec;31(3):351-6. doi: 10.1016/j.bcmd.2003.08.001. Blood Cells Mol Dis. 2003. PMID: 14636651 - Mutations in exon 2 of GATA1 are early events in megakaryocytic malignancies associated with trisomy 21.
Rainis L, Bercovich D, Strehl S, Teigler-Schlegel A, Stark B, Trka J, Amariglio N, Biondi A, Muler I, Rechavi G, Kempski H, Haas OA, Izraeli S. Rainis L, et al. Blood. 2003 Aug 1;102(3):981-6. doi: 10.1182/blood-2002-11-3599. Epub 2003 Mar 20. Blood. 2003. PMID: 12649131 - Acute megakaryoblastic leukaemia (AMKL) and transient myeloproliferative disorder (TMD) in Down syndrome: a multi-step model of myeloid leukaemogenesis.
Roy A, Roberts I, Norton A, Vyas P. Roy A, et al. Br J Haematol. 2009 Oct;147(1):3-12. doi: 10.1111/j.1365-2141.2009.07789.x. Epub 2009 Jul 6. Br J Haematol. 2009. PMID: 19594743 Review. - Down syndrome and malignancies: a unique clinical relationship: a paper from the 2008 william beaumont hospital symposium on molecular pathology.
Xavier AC, Ge Y, Taub JW. Xavier AC, et al. J Mol Diagn. 2009 Sep;11(5):371-80. doi: 10.2353/jmoldx.2009.080132. J Mol Diagn. 2009. PMID: 19710397 Free PMC article. Review.
Cited by
- DYRK1A interacts with the tuberous sclerosis complex and promotes mTORC1 activity.
Wang P, Sarkar S, Zhang M, Xiao T, Kong F, Zhang Z, Balasubramanian D, Jayaram N, Datta S, He R, Wu P, Chao P, Zhang Y, Washburn M, Florens LA, Nagarkar-Jaiswal S, Jaiswal M, Mohan M. Wang P, et al. Elife. 2024 Oct 22;12:RP88318. doi: 10.7554/eLife.88318. Elife. 2024. PMID: 39436397 Free PMC article. - Down syndrome-associated leukaemias: current evidence and challenges.
Mason NR, Cahill H, Diamond Y, McCleary K, Kotecha RS, Marshall GM, Mateos MK. Mason NR, et al. Ther Adv Hematol. 2024 Jul 23;15:20406207241257901. doi: 10.1177/20406207241257901. eCollection 2024. Ther Adv Hematol. 2024. PMID: 39050114 Free PMC article. Review. - Insights into the Clinical, Biological and Therapeutic Impact of Copy Number Alteration in Cancer.
Carey-Smith SL, Kotecha RS, Cheung LC, Malinge S. Carey-Smith SL, et al. Int J Mol Sci. 2024 Jun 21;25(13):6815. doi: 10.3390/ijms25136815. Int J Mol Sci. 2024. PMID: 38999925 Free PMC article. Review. - A rare presentation and treatment challenges for multiple myeloma in down syndrome: A case report and literature review.
Musleh M, Alhusein Q. Musleh M, et al. Clin Case Rep. 2024 Jul 3;12(7):e9154. doi: 10.1002/ccr3.9154. eCollection 2024 Jul. Clin Case Rep. 2024. PMID: 38962468 Free PMC article. - The ETO2 transcriptional cofactor maintains acute leukemia by driving a MYB/EP300-dependent stemness program.
Fagnan A, Aid Z, Baille M, Drakul A, Robert E, Lopez CK, Thirant C, Lecluse Y, Rivière J, Ignacimouttou C, Salmoiraghi S, Anguita E, Naimo A, Marzac C, Pflumio F, Malinge S, Wichmann C, Huang Y, Lobry C, Chaumeil J, Soler E, Bourquin JP, Nerlov C, Bernard OA, Schwaller J, Mercher T. Fagnan A, et al. Hemasphere. 2024 Jun 19;8(6):e90. doi: 10.1002/hem3.90. eCollection 2024 Jun. Hemasphere. 2024. PMID: 38903535 Free PMC article.
References
- Mitelman F, Heim S, Mandahl N. Trisomy 21 in neoplastic cells. Am J Med Genet Suppl. 1990;7:262–266. - PubMed
Publication types
MeSH terms
Substances
LinkOut - more resources
Full Text Sources
Other Literature Sources
Medical
Molecular Biology Databases

