Ultrastructure of synapses in the mammalian brain - PubMed (original) (raw)
Review
Ultrastructure of synapses in the mammalian brain
Kristen M Harris et al. Cold Spring Harb Perspect Biol. 2012.
Abstract
The morphology and molecular composition of synapses provide the structural basis for synaptic function. This article reviews the electron microscopy of excitatory synapses on dendritic spines, using data from rodent hippocampus, cerebral cortex, and cerebellar cortex. Excitatory synapses have a prominent postsynaptic density, in contrast with inhibitory synapses, which have less dense presynaptic or postsynaptic specializations and are usually found on the cell body or proximal dendritic shaft. Immunogold labeling shows that the presynaptic active zone provides a scaffold for key molecules involved in the release of neurotransmitter, whereas the postsynaptic density contains ligand-gated ionic channels, other receptors, and a complex network of signaling molecules. Delineating the structure and molecular organization of these axospinous synapses represents a crucial step toward understanding the mechanisms that underlie synaptic transmission and the dynamic modulation of neurotransmission associated with short- and long-term synaptic plasticity.
Figures
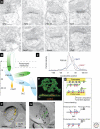
Figure 1.
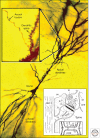
Golgi-impregnated pyramidal cell in hippocampal area CA1, showing the soma and apical and basal dendrites. (inset, left) Higher magnification shows an axon passing by dendritic spines protruding from the apical dendritic shaft. (inset, right) A drawing from the earliest EMs of dendritic spines: (a) spine apparatus; (b) spine neck; (c) presynaptic membrane; (den.t.) dendritic microtubules; (d) dense material in synaptic cleft; (e) postsynaptic membrane; (f) synaptic cleft; (g,h,i) plasma membranes of pre-, post-, and neighboring processes; (m) mitochondrion; (pre) presynaptic axons; (st) “stalk” of axon; (sv) synaptic vesicles. (Images are modified from Gray 1959 and Harris et al. 1980; reprinted, with permission, from Oxford University Press © 1959 and Elsevier © 1980, respectively.)
Figure 2.
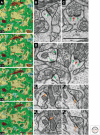
Synaptic neuropil. (A) Serial section EM images from the CA1 field of adult rat hippocampus are color-coded to illustrate the felt-like neuropil, which is dominated by excitatory axons (green) and spiny dendrites (yellow). One nonspiny dendrite (brown, also NS in panel D) and pieces of four inhibitory axons (orange) are visible in these sections, typical of their sparse distribution in the neuropil. Several thin astroglial processes (light blue) interdigitate among the axons and dendrites. (B) Asymmetric synapse with a macular PSD (green arrow) on a medium-size dendritic spine (sp). (C) PSD (green arrows) perforated by an electron-lucent region (red arrow) on a large dendritic spine (sp) with some SER at its base. (D) Asymmetric synapses (green arrows) on the shaft of a nonspiny dendrite (ns) containing a mitochondrion (mito) have comparable thicknesses to the macular and perforated PSDs on dendritic spines in the same field. (E) Adjacent sections through a symmetric synapse (orange arrows) on a spiny dendritic shaft (the arrow in E 2 points to a presynaptic docked vesicle). (F) Adjacent sections through another symmetric synapse (orange arrows) formed by the same axon as in E, but on a different spiny dendritic shaft. The 1-µm scale bar in section 139 is for the neuropil series in A; the 1-µm scale bar in C is for panels B_–_F.
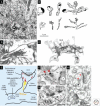
Figure 3.
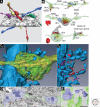
Presynaptic axons. (A) Three-dimensional (3D) reconstructions of CA3-to-CA1 axons (Schaffer collaterals). (B) 3D reconstructions of axons with vesicles (yellow) and associated postsynaptic partners (dendritic spine, gray; PSD surface, red). Typical single synaptic boutons (SSB) have a single postsynaptic partner, multisynaptic boutons (MSB) have more than one postsynaptic partner, and nonsynaptic boutons (NSB) contain vesicles but have no postsynaptic partners. Also illustrated are small dense core vesicles (dcvs, dark blue), mitochondria (mito, pale blue), and a multivesicular body (mvb, dark green with brown vesicles). (C 1) 3D reconstruction of a proximal CA3 pyramidal cell dendrite (blue) and a large mossy fiber bouton (translucent yellow), which contains numerous mitochondria (yellow) and vesicles (green). The cut-away in C 2 shows synapses (red) onto multiple dendritic spines, some of which are highly branched. The bouton also forms nonsynaptic cell adhesion junctions (fuchsia). (D) Electron micrograph through inhibitory presynaptic boutons (purple) that form symmetric synapses (red arrows) on the soma of a CA1 pyramidal cell. Scale bar, 500 nm. (E) 3D reconstruction of four complete inhibitory synaptic boutons (purple) interspersed with glial processes (green) on the surface of a CA1 pyramidal cell soma (gray). The magnifications of all 3D images in A_–_C have been rescaled to match the 1-µm scale bar in E. (Panel A is from Shepherd and Harris 1998; reprinted, with permission, from the authors; B is from Sorra et al. 2006; reprinted, with permission, from the authors; the image in panel C is modified from a supplemental movie by Rollenhagen et al. 2007; reprinted, with permission, from the Journal of Neuroscience © 2007; panels D and E are from Ledoux and Woolley 2005; reprinted, with permission, from the Journal of Neuroscience © 2005.)
Figure 4.
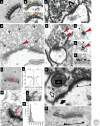
Presynaptic active zone (AZ) and vesicles. (A) Presynaptic dense projections (dp), a postsynaptic density (PSD), and the “intercleft line” (iL) at cerebellar synapses, revealed by ethanolic phosphotungstic acid. (B) Two serial sections through a parallel fiber synapse on a dendritic spine (Sp) in cerebellar cortex illustrate docked synaptic vesicles (green), which have no cytoplasm between the membrane of the vesicle and the AZ membrane (red arrows). The small black arrow points to a vesicle close to the membrane, but not docked. (C) Hippocampal CA3→CA1 synapse; note the docked vesicle (curved arrow, red arrow) and a presynaptic endocytic zone identified by a coated pit (straight arrow). (D) Large clear vesicles (arrows) and a DCV (red arrowhead) at the presynaptic AZ, and nondocked small synaptic vesicles in the reserve pool (arrowheads) of a CA3 mossy fiber bouton synapsing with a large dendritic spine (SP). (E) Small DCVs (red arrowheads) colocalize with small clear vesicles at a hippocampal CA1 spine synapse; and pre-embedding immunogold labeled for Piccolo (F) and Bassoon (G). (H) Bassoon localized to the AZ. (I) Post-embedding immunogold labeling for the big potassium channel (BK) located at the presynaptic active zone of a synapse on a small dendritic spine in s. radiatum of area CA1 (double-headed red arrow). (J) Positions of gold particles were compiled from the postsynaptic to presynaptic side; the glutamatergic NMDA receptor concentrated on the postsynaptic side, whereas BK channels concentrated on the presynaptic side (gold particles for NMDA are not visible in I). (K) Post-embedding immunogold labeling for CAST. Gold particles have been colored red for emphasis; original version of boxed region is shown in L. (M) Quantitative distribution of CAST with distance (in nanometers) from the presynaptic plasma membrane (arrow on _x-_axis). (N) Puncta adherens (PA) adjacent to the synaptic active zone (delimited beneath the PSD by triangles and line) of a large CA1 dendritic spine. (O) Silver-enhanced immunogold labeling for the cell adhesion molecule β-catenin, at the edge of an AZ on a cerebellar dendritic spines. All images have been scaled to match the 100-nm bar in C. (Panel A is adapted from van der Want et al. 1984; reprinted, with permission, from Elsevier © 1984; panel B is from Xu-Friedman et al. 2001; reprinted, with permission, from the author; panel C is from Harris and Sultan 1995; reprinted, with permission, from the author; panel D is from Henze et al. 2002; reprinted, with permission, from the author; panel E is from Sorra et al. 2006; reprinted, with permission, from the author; panel F is from Zhai et al. 2001, panels G and H are from Tao-Cheng 2007; reprinted, with permission, from Elsevier © 2001; panels I and J are from Hu et al. 2001; reprinted, with permission, from the Journal of Neuroscience © 2001; panels K–M are modified from Siksou et al. 2007; panel N is from Spacek and Harris 1998; reprinted, with permission, from the author; panel O is modified from Uchida et al. 1996.)
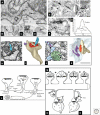
Figure 5.
Postsynaptic dendritic spines. (A) 3D reconstruction of cerebellar Purkinje cell dendrite; note the relatively uniform shape of the dendritic spines (arrows). (B) 3D reconstruction of hippocampal CA1 dendrite, showing immature filopodia-like (f) and stubby (st) protrusions on the same segment as spines with mushroom (m) and thin (t) shapes. Scale, 1 µm; the red surfaces are the PSD areas for both A and B. (C) The area of the PSD at hippocampal synapses is strongly correlated with both the volume of the spine (_left y_-axis) and the number of vesicles in the presynaptic boutons (_right y_-axis). (Panels A and B are from
http://synapses.clm.utexas.edu/anatomy/compare/compare.stm
; reprinted, with permission, from J. Spacek; panel C is from Lisman and Harris 1993; reprinted, with permission, from the author.)
Figure 6.
Molecular anatomy of the PSD. (A) Post-embedding immunogold labeling for synaptophysin (SYN), a presynaptic vesicle-associated protein, and seven postsynaptic proteins: NMDA receptor (NR2), PSD-95, neuronal nitric oxide synthase (nNOS), cysteine-rich interactor of PDZ three (CRIPT), guanylate kinase-associated protein (GKAP), Shank, and dynein light chain (DLC). (B) The diagram illustrates supramolecular organization of the PSD. Location of each ellipsoid is according to mean immunogold positions, ellipsoid volumes are proportional to the molecular weight of each protein, and contacts are shown between proteins known to interact biochemically. (C) Axo-dendritic positions relative to the postsynaptic plasma membrane (0 nm on the _x_-axis) of gold particles coding for three of these proteins (PSD-95, CRIPT, and GKAP). (D) “Immunogold-PSD” labeling for CaMKIIα (orange) on a biochemically isolated PSD (green) viewed en face (top) and with EM tomography from the side, where the postsynaptic membrane (PM) is at the bottom. (E) The schematic illustrates methods for SDS-FRL: Freeze-fracture follows the hydrophobic interior of the plasma membrane, and proteins pull to either the exoplasmic (E-face) or the cytoplasmic (P-face). After application of a thin platinum/carbon film, the material is digested in hot SDS, and the replicas are immunogold labeled. (F) Hippocampal CA1 spine synapses in s. radiatum, labeled by SDS-FRL for the GluR1 and NR1 glutamate receptor subunits, and (G) NR2B and NR1 subunits (the black line outlines the intramembranous particle aggregate in the E-face). Scale bars, 100 nm. (Panels A–C are from Valtschanoff and Weinberg 2001; reprinted, with permission, from the author; panel D is from Petersen et al. 2003; reprinted, with permission, from the Journal of Neuroscience © 2001; panels E–G are modified from Shinohara et al. 2008.)
Figure 7.
Dendritic SER. (A) Purkinje cell dendrite (star) and associated spines determined by serial section EM (arrows, some of which are numbered); all of these spines contain SER (e.g., large arrow in spine 25); and a nonspiny dendrite of an interneuron (non). (B) 3D reconstructions of cerebellar dendritic spines (top row, short, medium, long, and branched) and SER tubules (bottom row) illustrate close correlation between spine and SER volume. (C) 3D reconstruction of CA1 dendrite SER, which enters only three spines, two of which have a spine apparatus (SA). (D) The SA has laminated SER (arrows) interspersed with dense-staining material (wavy lines). (E) Summary diagram of Golgi- and secretory-related molecules found in SA and vesicular compartments. (F) SA containing silver-enhanced gold labeling for giantin (red arrowheads), a protein involved in vesicle trafficking through the Golgi apparatus. (G) Post-embedding immunogold labeling for synaptopodin (black arrows), an actin-associated protein, in a spine apparatus from a dendritic spine in the s. radiatum of area CA3. (H) Post-embedding immunogold labeling for IP3 receptors (red arrowheads) along SER in a cerebellar spine head (Sp). Scale bar in B is 1 μm and applies to A–C. Scale bars in D, F, G, and H are all 250 nm. (Panels A and B are from Harris and Stevens 1988a; reprinted, with permission, from the author; panel C is from Cooney et al. 2002; reprinted, with permission, from the author; panel D is from Spacek and Harris 1997; reprinted, with permission, from the author; panels E and F are from Pierce et al. 2001; reprinted, with permission, from Elsevier © 2001; panel G is modified from Deller et al. 2000; panel H is modified from Kelm et al. 2010.)
Figure 8.
Ribosomes indicate sites of local protein synthesis. (A) Non-uniform distribution of ribosomes (black dots) in hippocampal CA1 dendrite and spines (red, PSD surface area). (B) Free polyribosomes (red arrows) and putative monosomes (blue arrows) in a large mushroom spine with an en face PSD (encircled in red). (C) Polyribosome (red arrow) associated with endoplasmic reticulum of a spine apparatus (SA) in a dendritic spine (S) adjacent to a neuron (N) in mouse neocortex. Scales, 200 nm. (Panel A is from
http://synapses.clm.utexas.edu/anatomy/ribosome/ribo2.stm
; reprinted, with permission, from J. Spacek; panel B is modified from Bourne et al. 2007a; reprinted, with permission, from the author; panel C is from
http://synapses.clm.utexas.edu/anatomy/ribosome/ribo3.stm
; reprinted, with permission, from J. Spacek.)
Figure 9.
Endocytosis and trans-endocytosis at dendritic spines. (A) SER, small vesicles (sv), and recycling endosomes; the latter may be identified by their content of gold-BSA endocytosed from the extracellular space (ECS) into large vesicles (lv), (B) tubules, (C) amorphous vesicular clumps, and (D) multivesicular bodies. (E–G) Silver-enhanced pre-embedding immunogold identifies three proteins (AP-2, clathrin, and dynamin) critical for endocytosis; label for all three concentrates close to the spine plasma membrane. To assess their position with respect to the synapse, the locus of each particle was projected onto the spine plasma membrane as illustrated in F, allowing computation of a normalized tangential distance along the plasma membrane. As shown for clathrin in G, each of these endocytic proteins concentrated in a sector of the spine lying roughly halfway between the edge of the PSD and the point on the spine plasma membrane closest to the spine neck opposite to the PSD (illustrated as “1” in the inset) (for further description, see Racz et al. 2004). (H) Spinule (blue) emerging from the middle of a perforated PSD (triangle) on a dendritic spine head; this spinule is engulfed by the plasma membrane of the presynaptic axon. (I) 3D reconstruction of the spinule in H (blue), and also a second smaller spinule (purple) being engulfed by a neighboring axon, not shown). (J) Spinule from a dendritic spine (purple arrow, top) being engulfed by a perisynaptic astroglial process (light blue), and a second smaller spinule from a different spine (purple arrowhead, bottom) being engulfed by a neighboring axon (green), similar to the purple reconstruction in I. (K) 3D reconstruction of the astroglial-engulfed spinule shown on a single section in J (spinule [purple], astroglial process [light blue], spine [tan], PSD [red]). (L–O) Contrasting endocytosis and trans-endocytosis. (L) A single MVB-tubular sorting complex in the dendritic shaft serves multiple dendritic spines, where coated pits and vesicles are endocytosed from some spines, and small vesicles bud off (also via coats) from tubular endosomes, to be exocytosed at the plasma membrane of neighboring spines. (M) Trans-endocytosis from a spine to the presynaptic axon may serve to transmit signaling molecules or to remove perforations following sustained presynaptic activation. (N) Trans-endocytosis by neighboring axons may reflect competition for the postsynaptic spine. (O) The function of trans-endocytosis by neighboring astroglial processes is unknown. Scales, (A–D, H–K) 500 nm; (E, F) 200 nm. (Panels A–D and L are from Cooney et al. 2002; reprinted, with permission, from the authors; panels E–G are from Racz et al. 2004; reprinted, with permission, from the authors; and panels H–K and M–O are from Spacek and Harris 2004; reprinted, with permission, from the authors.)
Similar articles
- Three-dimensional organization of cell adhesion junctions at synapses and dendritic spines in area CA1 of the rat hippocampus.
Spacek J, Harris KM. Spacek J, et al. J Comp Neurol. 1998 Mar 30;393(1):58-68. doi: 10.1002/(sici)1096-9861(19980330)393:1<58::aid-cne6>3.0.co;2-p. J Comp Neurol. 1998. PMID: 9520101 - Beyond counts and shapes: studying pathology of dendritic spines in the context of the surrounding neuropil through serial section electron microscopy.
Kuwajima M, Spacek J, Harris KM. Kuwajima M, et al. Neuroscience. 2013 Oct 22;251:75-89. doi: 10.1016/j.neuroscience.2012.04.061. Epub 2012 May 1. Neuroscience. 2013. PMID: 22561733 Free PMC article. Review. - Localization of EphA4 in axon terminals and dendritic spines of adult rat hippocampus.
Tremblay ME, Riad M, Bouvier D, Murai KK, Pasquale EB, Descarries L, Doucet G. Tremblay ME, et al. J Comp Neurol. 2007 Apr 10;501(5):691-702. doi: 10.1002/cne.21263. J Comp Neurol. 2007. PMID: 17299751 - Volume electron microscopy of the distribution of synapses in the neuropil of the juvenile rat somatosensory cortex.
Santuy A, Rodriguez JR, DeFelipe J, Merchan-Perez A. Santuy A, et al. Brain Struct Funct. 2018 Jan;223(1):77-90. doi: 10.1007/s00429-017-1470-7. Epub 2017 Jul 18. Brain Struct Funct. 2018. PMID: 28721455 Free PMC article. - Imaging of spine synapses using super-resolution microscopy.
Kashiwagi Y, Okabe S. Kashiwagi Y, et al. Anat Sci Int. 2021 Jun;96(3):343-358. doi: 10.1007/s12565-021-00603-0. Epub 2021 Jan 18. Anat Sci Int. 2021. PMID: 33459976 Review.
Cited by
- Ultrastructural characterization of hippocampal inhibitory synapses under resting and stimulated conditions.
Tao-Cheng JH, Moreira SL, Winters CA. Tao-Cheng JH, et al. Mol Brain. 2024 Oct 22;17(1):76. doi: 10.1186/s13041-024-01151-0. Mol Brain. 2024. PMID: 39438991 Free PMC article. - The Diversity of Spine Synapses in Animals.
Petralia RS, Wang YX, Mattson MP, Yao PJ. Petralia RS, et al. Neuromolecular Med. 2016 Dec;18(4):497-539. doi: 10.1007/s12017-016-8405-y. Epub 2016 May 26. Neuromolecular Med. 2016. PMID: 27230661 Free PMC article. Review. - An antioxidant specifically targeting mitochondria delays progression of Alzheimer's disease-like pathology.
Stefanova NA, Muraleva NA, Maksimova KY, Rudnitskaya EA, Kiseleva E, Telegina DV, Kolosova NG. Stefanova NA, et al. Aging (Albany NY). 2016 Oct 6;8(11):2713-2733. doi: 10.18632/aging.101054. Aging (Albany NY). 2016. PMID: 27750209 Free PMC article. - Tracing nerve fibers with volume electron microscopy to quantitatively analyze brain connectivity.
Turegano-Lopez M, de Las Pozas F, Santuy A, Rodriguez JR, DeFelipe J, Merchan-Perez A. Turegano-Lopez M, et al. Commun Biol. 2024 Jul 1;7(1):796. doi: 10.1038/s42003-024-06491-0. Commun Biol. 2024. PMID: 38951162 Free PMC article. - Docosahexaenoic acid (DHA): a modulator of microglia activity and dendritic spine morphology.
Chang PK, Khatchadourian A, McKinney RA, Maysinger D. Chang PK, et al. J Neuroinflammation. 2015 Feb 22;12:34. doi: 10.1186/s12974-015-0244-5. J Neuroinflammation. 2015. PMID: 25889069 Free PMC article.
References
- Ahmari SE, Smith SJ 2002. Knowing a nascent synapse when you see it. Neuron 34: 333–336 - PubMed
- Amaral DG, Dent JA 1981. Development of the mossy fibers of the dentate gyrus: I. A light and electron microscopic study of the mossy fibers and their expansions. J Comp Neurol 195: 51–86 - PubMed
- Baude A, Bleasdale C, Dalezios Y, Somogyi P, Klausberger T 2007. Immunoreactivity for the GABAA receptor α1 subunit, somatostatin and Connexin36 distinguishes axoaxonic, basket, and bistratified interneurons of the rat hippocampus. Cereb Cortex 17: 2094–2107 - PubMed
Publication types
MeSH terms
LinkOut - more resources
Full Text Sources
