EPAC null mutation impairs learning and social interactions via aberrant regulation of miR-124 and Zif268 translation - PubMed (original) (raw)
. 2012 Feb 23;73(4):774-88.
doi: 10.1016/j.neuron.2012.02.003.
Xiaogang Shu, Dan Liu, You Shang, Yan Wu, Lei Pei, Xin Xu, Qing Tian, Jian Zhang, Kun Qian, Ya-Xian Wang, Ronald S Petralia, Weihong Tu, Ling-Qiang Zhu, Jian-Zhi Wang, Youming Lu
Affiliations
- PMID: 22365550
- PMCID: PMC3307595
- DOI: 10.1016/j.neuron.2012.02.003
EPAC null mutation impairs learning and social interactions via aberrant regulation of miR-124 and Zif268 translation
Ying Yang et al. Neuron. 2012.
Abstract
EPAC proteins are the guanine nucleotide exchange factors that act as the intracellular receptors for cyclic AMP. Two variants of EPAC genes including EPAC1 and EPAC2 are cloned and are widely expressed throughout the brain. But, their functions in the brain remain unknown. Here, we genetically delete EPAC1 (EPAC1(-/-)), EPAC2 (EPAC2(-/-)), or both EPAC1 and EPAC2 genes (EPAC(-/-)) in the forebrain of mice. We show that EPAC null mutation impairs long-term potentiation (LTP) and that this impairment is paralleled with the severe deficits in spatial learning and social interactions and is mediated in a direct manner by miR-124 transcription and Zif268 translation. Knockdown of miR-124 restores Zif268 and hence reverses all aspects of the EPAC(-/-) phenotypes, whereas expression of miR-124 or knockdown of Zif268 reproduces the effects of EPAC null mutation. Thus, EPAC proteins control miR-124 transcription in the brain for processing spatial learning and social interactions.
Copyright © 2012 Elsevier Inc. All rights reserved.
Figures
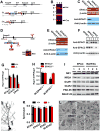
Figure 1. Generation of Genetically Modified EPAC Strains of Mice
(A-C) EPAC1 gene targeting construct and deletion strategies (A) and Southern blots (B) of the homozygous (lane 1), heterozygous (lane 2) and wildtype (lane 3) of the floxed (B, top) and the constitutive (B, bottom) EPAC1 knockouts. RT-PCR and Western blots of EPAC1 mRNA (C, top) and protein (C, bottom) in EPAC1-/- mice. (D and E) The mouse embryonic stem cells (D, top) carrying EPAC2 allele disrupted by inserting a gene trap vector in the first axon were cloned to generate EPAC2 mutant mice. Southern blot (D, bottom) of null mutant mice verified the Neo signal. EPAC2 mRNA (E, top) and protein (E, bottom) are deleted in EPAC-/- mice. (F) A combined deletion of EPAC1 and EPAC2 proteins in the forebrain of EPAC-/- mice. (G and H) EPAC activity is reduced in the forebrain of EPAC-/- (G) and IN-EPAC1-/- (H) mice. Data are mean ± SEM (n = 4 assays, *p < 0.01, compared to the respective wildtype control mice). (I) Western blots of the membrane fractions from homozygous (lane 1), heterozygous (lane 2) and wildtype (lane 3) mice. Similar results were observed in each of the four experiments. (J and K) A representative image shows a Golgi-labeled CA1 pyramidal neuron (J). Bar graph shows averaged spine densities for each genotype (K) (mean ± SEM, n = _4, p_ > 0.01). (L) Electron microscopy of the CA1 area reveals normal synaptic ultrastructure in EPAC-/- mice. P: pre-synaptic terminal. Scale bars are 100 nm in the 2 left micrographs and 500 nm in the others. Similar results were observed in each of three assays.
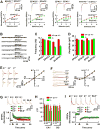
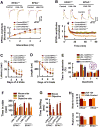
Figure 2. Synaptic Transmission and LTP Are Abnormal in EPAC-/- Neurons
(A) Excitatory synaptic strength decreases in EPAC-/- and IN-EPAC-/- neurons. Traces are EPSCs at holding potential of – 70 mV in response to stimulus intensities from 1 to 4 mV at an interval of 0.5 mV. The EPSCs amplitudes are normalized to the base line (defined as 1.0) and plotted against the stimulus intensities (mean ± SEM (n = 16 recordings/8 mice/group, * p < 0.01, compared to the respective wild-type control mice). (B-D) Representatives (B) are spontaneous EPSCs. Bar graphs show the frequency (C) and mean amplitudes of EPACs (D, mean ± SEM, n = 14 recordings/7 mice/group, *p < 0.01, compared to the respective wild-type control mice). (E and F) Representative traces are recorded at the holding potentials of -80, -40, 0, 20, or 40 mV. The normalized EPSCs (N.C.) mediated by AMPA (E) and the NMDA receptors (F) are plotted against the holding potentials (mV). Data are mean ± SEM (n = 12 recordings/6 mice/group). (G and H) The peak amplitudes of the intracellular EPSPs (G) are normalized to the baseline (defined as 1.0). The traces (G, top) are representative EPSPs at basal line (black) and 60 min after tetanus (red). Arrow indicates the time of tetanus. A bar graph (H) shows the normalized EPSPs amplitude 60 min after tetanus in CA1 neurons and the dentate granule cells (DG) (mean ± SEM, n = 12 recordings/6 mice/group, *p < 0.01, compared to the respective wild-type control mice). (I) The peak amplitudes of EPSPs are normalized to the baseline (defined as 1.0). The traces are EPSPs at basal line (black) and 30 min after tetanus (red, mean ± SEM, n =12 recordings/6 mice/group). In Figure 2C-2I, E1-/-, E2-/-, E-/-, IN-E-/-, and E+/- indicate EPAC1-/-, EPAC2-/-, EPAC-/-, IN-EPAC-/-, and heterozygous (EPAC+/-) mice, respectively.
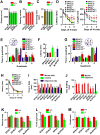
Figure 3. EPAC Null Mutation Impairs Spatial Learning and Social Interactions
(A-C) Distance moved (A), rearing (B) and grooming (C) in the open field tests are identical among genotypes (mean ± SEM , n = 12 mice per group). (D and E) EPAC null alleles show abnormalities in spatial learning. The latency (D) and swim path length to reach a hidden platform are plotted against the blocks of trials. A bar graph (E) shows the percentage of time spent in searching of a hidden platform in each quadrant during the probe trial (mean ± SEM, n =16 mice/group, *p < 0.01, compared to the EPAC+/- and IN-EPAC+/+ mice, respectively). (F and G) EPAC null alleles show the abnormalities in reversal learning. The latency (F) to reach a hidden platform and the percentage of time spent (G) in searching of a new hidden platform in each quadrant (mean ± SEM, n =16 mice/group, *p < 0.01, compared to the EPAC+/- and IN-EPAC+/+ mice, respectively). (H) The latency to reach a visible platform is identical among genotypes (mean ± SEM, n =16 mice/group). (I and J) Adult EPAC-/- mice have abnormal social interactions. Time spent in each chamber (I) and sniffing time (J) with an unfamiliar mouse and unfamiliar object during the 10-min test (mean ± SEM, n = 15 mice per group, *p < 0.01, compared to the EPAC+/- and IN-EPAC+/+ mice, respectively). (K-M) EPAC- mice are abnormal in juvenile plays. Bar graphs show nose-to-nose sniffing (K), front approach (L) and push/crawl (M) with an unfamiliar mouse during juvenile play (mean ± SEM, n = 18 mice per group, *p < 0.01, compared to the EPAC+/+ and IN-EPAC+/+ mice, respectively).
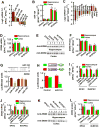
Figure 4. miR-124 Inhibits Zif268 mRNA translation
(A) miRNA array shows miRNA fold changes (F.C.) in the forebrain of EPAC-/- mice versus EPAC+/+ mice (mean ±SEM, n = 12 assay, *p < 0.01). (B) qPCR shows miR-124 in the hippocampus and the prefrontal cortex of adult mice (mean ± SEM, n = 6, *p < 0.01). (C) mRNA array shows mRNA fold changes (F.C.) in the forebrain of EPAC-/- mice versus EPAC+/+ mice (mean ±SEM, n = 12 assay, *p < 0.01). (D) qPCR shows Zif268 mRNA in the hippocampus and prefrontal cortex of adult mice (mean ± SEM, n = 6, *p < 0.01). (E and F) Representative (E) and summarized data (F) show Zif268 protein levels in the homozygous mutants (lane 1) and control littermates (lane 2) (mean ± SEM, n = 4, *p < 0.01). (G and H) miR-124 binding sequence in the 3′ UTR region of Zif268 and inhibits the wildtype (G), but not the mutant (H), Zif268 3′UTR luciferase activity (mean ± SEM, n = 4, *p < 0.01, compared to control). (I) qPCR shows miR-124 in the hippocampus and the prefrontal cortex 48 hours after the injections of LNA-miR-124 or LNA-control, or saline (Mean ± SEM, n = 6 assays, *p < 0.01, compared to control). (J) Zif268 mRNA in adult mice 48 hours after injection of saline or LNA-miR-124 (LNA-124) or LNA-control. Data are expressed as the ratio of mRNA in EPAC-/- versus EPAC+/+ mice (mean ± SEM , n = 6 assays/3 mice, *p < 0.01, compared to saline). (K and L) Representative (K) and summarized Zif268 protein (L) in adult mice 48 hours after injection of LNA-miR-124 (lane 1) or LNA-control (lane 2). Data are expressed as the ratio of band intensities in homozygous (-/-) versus wild-type control (+/+) (mean ± SEM, n = 6 assays/3 mice/group, *p < 0.01, compared to LNA-control).
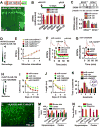
Figure 5. Knockdown of miR-124 Rescues the EPAC-/- Phenotypes
(A) LNA-miR-124 produces no effects on basal synaptic transmission. Representative EPSCs are recorded at the holding potential of – 70mV in response to stimulus intensities from 1 to 4 mV at an interval of 0.5 mV in slices from mice 48 hours after the injection of LNA-miR-124 (LNA-124). The peak amplitudes of EPSCs are normalized to the baseline (defined as 1.0) and plotted against the stimulus intensity (mean ± SEM, n = 10 recordings/5 mice/group). (B) LNA-miR-124 reverses the LTP deficits in EPAC-/- neurons. The peak amplitudes of EPSPs are normalized to the baseline (defined as 1.0). EPSPs sweeps (above the graphs) taken at the time indicated by the letter on the x axis. Arrow indicates the time of tetanus. Data are mean ± SEM (n =12 recordings/6 mice/group). (C-E) LNA-miR-124 rescues the spatial learning deficits in EPAC null alleles. The latency (C) and swim path length (D) to reach a hidden platform in the Morris water maze are plotted against the blocks of trials. A bar graph (E) shows the percentage of time spent in searching of a hidden platform in each quadrant during the probe trial (mean ± SEM, n =16 mice/group, *p < 0.01, compared to the injection of LNA-control in EPAC+/+ mice). (F and G) LNA-miR-124 rescues the social behavioral deficits in EPAC null alleles. Time spent in each chamber (F) and sniffing time (G) with an unfamiliar mouse and unfamiliar object during the 10-min test (mean ± SEM, n = 16 mice per group, *p < 0.01, compared to the LNA-control in EPAC+/+ mice). (H) LNA-miR-124 improves the juvenile plays of EPAC-/- mice. The push/crawl and the nose-to-nose sniffing with an unfamiliar mouse during juvenile play (mean ± SEM, n = 18 mice per group, *p < 0.01, compared to the LNA-control in EPAC+/+ mice).
Figure 6. miR-124 Mimics the Effects of EPAC Null Mutation
(A) The rAAV1/2 vector (top) for expression of miR-124 and eGFP and a representative image (bottom) is taken in the hippocampus of adult mice 12 days after the rAAV1/2-124 injection. (B) miR-124 inhibits Zif268 mRNA expression. qPCR shows mRNA expression profiling in the hippocampus of adult mice 12 days after injection of rAAV1/2-miR-124 (miR-124) or rAAV1/2-miR-145 (miR-145) and rAAV1/2-negative control (control). Data are expressed as the ratio of miR-124 or miR-145 expression versus control (mean ± SEM, n = 4 assays, *p < 0.01, compared to miR-145). (C) miR-124 reduces Zif268 protein expression. Western blots of Zif268 protein in the hippocampus of adult mice 12 days after expression of control (lane 1) or miR-124 (lane 2) or miR-145 (lane 3). The intensities of each band are normalized to β-actin in EPAC+/+ mice control lane (mean ± SEM, n = 4 assays, *p < 0.01, compared to miR-control in EPAC+/+ mice). (D and E) miR-124 produces no effects on basal synaptic transmission. The experimental schedule (D) and the amplitudes of EPSCs (E) normalized to the baseline (defined as 1.0) and plotted against the stimulus intensity (mean ± SEM, n = 12). (F and G) miR-124 inhibits LTP expression. The peak amplitudes of EPSPs are normalized to the baseline (defined as 1.0). EPSPs sweeps taken at the time indicated by the letter on the x axis. Arrow indicates the time of tetanus. Data are mean ± SEM (n =15 recordings/5 mice/group). (H-K) miR-124 causes the spatial learning deficits. The experimental schedule (H) and the latency (I) and swim path length (J) to reach a hidden platform are plotted against the blocks of trials. The percentage of time spent (K) in searching of a hidden platform in each quadrant during the probe trial (mean ± SEM, n =15 mice/group, *p < 0.01, compared to miR-control). (L-N) Expression of miR-124 in the prefrontal cortex but not in the hippocampus causes the social behavioral deficits. An image shows miR-124-eGFP in the prefrontal cortex of adult male mice 12 days after the injection of the rAAV1/2-miR-124-IRES-eGFP. Bar graphs show the time spent in each chamber (M) and sniffing time (N) with an unfamiliar mouse and unfamiliar object (mean ± SEM, n = 15 mice/group, *p < 0.01, compared to control).
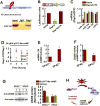
Figure 7. Rap1 Restricts miR-124 Transcription
(A) Rap1binds a sequence in the stem-loop precursor of miR-124 transcript (top). Northern blot (bottom) shows miR-124 precursor in the ChIP. (B) Expression of miR-124 luciferase reporter construction (top) with wild-type Rap1a in HEK293 cells have lower luciferase activity, compared with controls (eGFP or Rap1aS17N). Data are mean ± SEM (n = 4, *p < 0.01). (C) Rap1 inhibits miR-124 transcription in the hippocampal neurons. qPCR analysis of miRNA in the neuronal cultures (DIV16) from the mouse hippocampus 72 hours after expression of a dominant mutant Rap1a (Rap1aS17N) or wild-type Rap1a. Data are the miRNA fold changes in cells expressing Rap1aS17N or Rap1a versus eGFP (mean ± SEM, n = 4 assays, *p < 0.01 compared to Rap1aS17N). (D) Rap1 activity, as expressed the ratio of Rap1-GTP versus Rap1 is measured at the indicated time points after incubation of neuronal cultures (DIV16) with 20 μM 8-pCPT-Me-cAMP. Data are mean ± SEM (n = 5 assays, *p < 0.01, compared to a time point of 0 hour). (E) miR-124 is measured 6 hours after incubation of the EPAC+/+ or EPAC-/-neuronal cultures (DIV16) with 20 μM 8-pCPT-Me-cAMP or vehicle. Data are expressed as the ratio of 8-pCPT-Me-cAMP (cAMP) treatment versus vehicle (mean ± SEM , n = 5 assays, *p < 0.01, compared to EPAC-/- neurons). (F) Zif268 mRNA is measured 6 hours after incubation of the EPAC+/+ or EPAC-/-neuronal cultures (DIV16) with 20 μM 8-pCPT-Me-cAMP or vehicle. Data are expressed as the ratio of 8-pCPT-Me-cAMP (cAMP) treatment versus vehicle (mean ± SEM , n = 5 assays, *p < 0.01, compared to EPAC-/- neurons). (G) Zif268 protein is measured 6 hours after incubation of the EPAC+/+ or EPAC-/-neuronal cultures (DIV16) with vehicle (lane 1) or 20 μM 8-pCPT-Me-cAMP (lane 2). Band intensities are normalized to actin in vehicle treated EPAC+/+ neurons (mean ± SEM , n = 5 assays, *p < 0.01, compared to vehicle). (H) A working model demonstrating that miR-124 inhibition of Zif268 translation constitutes a specific signaling event downstream of EPAC proteins in regulation of plasticity, and spatial learning as well as social interactions.
Similar articles
- Deletion of exchange proteins directly activated by cAMP (Epac) causes defects in hippocampal signaling in female mice.
Aesoy R, Muwonge H, Asrud KS, Sabir M, Witsoe SL, Bjornstad R, Kopperud RK, Hoivik EA, Doskeland SO, Bakke M. Aesoy R, et al. PLoS One. 2018 Jul 26;13(7):e0200935. doi: 10.1371/journal.pone.0200935. eCollection 2018. PLoS One. 2018. PMID: 30048476 Free PMC article. - Mechanism of regulation of the Epac family of cAMP-dependent RapGEFs.
de Rooij J, Rehmann H, van Triest M, Cool RH, Wittinghofer A, Bos JL. de Rooij J, et al. J Biol Chem. 2000 Jul 7;275(27):20829-36. doi: 10.1074/jbc.M001113200. J Biol Chem. 2000. PMID: 10777494 - The RAP1 guanine nucleotide exchange factor Epac2 couples cyclic AMP and Ras signals at the plasma membrane.
Li Y, Asuri S, Rebhun JF, Castro AF, Paranavitana NC, Quilliam LA. Li Y, et al. J Biol Chem. 2006 Feb 3;281(5):2506-14. doi: 10.1074/jbc.M508165200. Epub 2005 Nov 29. J Biol Chem. 2006. PMID: 16316996 - Epac-selective cAMP analogs: new tools with which to evaluate the signal transduction properties of cAMP-regulated guanine nucleotide exchange factors.
Holz GG, Chepurny OG, Schwede F. Holz GG, et al. Cell Signal. 2008 Jan;20(1):10-20. doi: 10.1016/j.cellsig.2007.07.009. Epub 2007 Jul 25. Cell Signal. 2008. PMID: 17716863 Free PMC article. Review. - Cell physiology of cAMP sensor Epac.
Holz GG, Kang G, Harbeck M, Roe MW, Chepurny OG. Holz GG, et al. J Physiol. 2006 Nov 15;577(Pt 1):5-15. doi: 10.1113/jphysiol.2006.119644. Epub 2006 Sep 14. J Physiol. 2006. PMID: 16973695 Free PMC article. Review.
Cited by
- Deletion of miR-150 Prevents Spontaneous T Cell Proliferation and the Development of Colitis.
Ishihara S, Sato M, Miyazaki H, Saito H, Sato T, Fujikado N, Sawai S, Kotani A, Katagiri K. Ishihara S, et al. Gastro Hep Adv. 2023 Feb 4;2(4):487-496. doi: 10.1016/j.gastha.2023.01.021. eCollection 2023. Gastro Hep Adv. 2023. PMID: 39132043 Free PMC article. - EPAC inhibition of SUR1 receptor increases glutamate release and seizure vulnerability.
Zhao K, Wen R, Wang X, Pei L, Yang Y, Shang Y, Bazan N, Zhu LQ, Tian Q, Lu Y. Zhao K, et al. J Neurosci. 2013 May 15;33(20):8861-5. doi: 10.1523/JNEUROSCI.5686-12.2013. J Neurosci. 2013. PMID: 23678128 Free PMC article. - Social, communication, and cortical structural impairments in Epac2-deficient mice.
Srivastava DP, Jones KA, Woolfrey KM, Burgdorf J, Russell TA, Kalmbach A, Lee H, Yang C, Bradberry MM, Wokosin D, Moskal JR, Casanova MF, Waters J, Penzes P. Srivastava DP, et al. J Neurosci. 2012 Aug 22;32(34):11864-78. doi: 10.1523/JNEUROSCI.1349-12.2012. J Neurosci. 2012. PMID: 22915127 Free PMC article. - Anxiety and depression with neurogenesis defects in exchange protein directly activated by cAMP 2-deficient mice are ameliorated by a selective serotonin reuptake inhibitor, Prozac.
Zhou L, Ma SL, Yeung PK, Wong YH, Tsim KW, So KF, Lam LC, Chung SK. Zhou L, et al. Transl Psychiatry. 2016 Sep 6;6(9):e881. doi: 10.1038/tp.2016.129. Transl Psychiatry. 2016. PMID: 27598965 Free PMC article. - Epac2 in midbrain dopamine neurons contributes to cocaine reinforcement via enhancement of dopamine release.
Liu X, Vickstrom CR, Yu H, Liu S, Snarrenberg ST, Friedman V, Mu L, Chen B, Kelly TJ, Baker DA, Liu QS. Liu X, et al. Elife. 2022 Aug 22;11:e80747. doi: 10.7554/eLife.80747. Elife. 2022. PMID: 35993549 Free PMC article.
References
- Bacchelli E, et al. Screening of nine candidate genes for autism on chromosome 2q reveals rare nonsynonymous variants in the cAMP-GEFII gene. Mol Psychiatry. 2003;8:916–924. - PubMed
- Bartel DP. MicroRNAs: genomics, biogenesis, mechanism, and function. Cell. 2004;116:281–297. - PubMed
- Baumgärtel K, Genoux D, Welzl H, Tweedie-Cullen RY, Koshibu K, Livingstone-Zatchej M, Mamie C, Mansuy IM. Control of the establishment of aversive memory by calcineurin and Zif268. Nat Neurosci. 2008;11:572–578. - PubMed
- Benito E, Barco A. CREB's control of intrinsic and synaptic plasticity: implications for CREB-dependent memory models. Trends Neurosci. 2010;33:230–240. - PubMed
Publication types
MeSH terms
Substances
Grants and funding
- R01 NS051383/NS/NINDS NIH HHS/United States
- R01NS5051383/NS/NINDS NIH HHS/United States
- R01 AG033282/AG/NIA NIH HHS/United States
- R01AG033282/AG/NIA NIH HHS/United States
- ImNIH/Intramural NIH HHS/United States
LinkOut - more resources
Full Text Sources
Medical
Molecular Biology Databases
