Mitral cells in the olfactory bulb are mainly excited through a multistep signaling path - PubMed (original) (raw)
Comparative Study
Mitral cells in the olfactory bulb are mainly excited through a multistep signaling path
David H Gire et al. J Neurosci. 2012.
Abstract
Within the olfactory system, information flow from the periphery onto output mitral cells (MCs) of the olfactory bulb (OB) has been thought to be mediated by direct synaptic inputs from olfactory sensory neurons (OSNs). Here, we performed patch-clamp measurements in rat and mouse OB slices to investigate mechanisms of OSN signaling onto MCs, including the assumption of a direct path, using electrical and optogenetic stimulation methods that selectively activated OSNs. We found that MCs are in fact not typically activated by direct OSN inputs and instead require a multistep, diffuse mechanism involving another glutamatergic cell type, the tufted cells. The preference for a multistep mechanism reflects the fact that signals arising from direct OSN inputs are drastically shunted by connexin 36-mediated gap junctions on MCs, but not tufted cells. An OB circuit with tufted cells intermediate between OSNs and MCs suggests that considerable processing of olfactory information occurs before its reaching MCs.
Figures
Figure 1.
Assessment of direct OSN-EPSCs following electrical stimulation. ai, EPSCs recorded simultaneously from a same-glomerulus MC/ET cell pair in response to ON stimulation (20 μA). The ET cell, but not the MC, displayed a fast-occurring EPSC (arrowhead) distinct from a longer-lasting LLD. The diagonal arrows on expanded traces indicate estimated onset times for the EPSCs. All traces in figure are averages of 4–15 responses. aii, Images of the MC/ET cell pair from ai filled with Alexa 488 (100 μ
m
). Labeled is the target glomerulus of the two cells (dashed ring), as well as glomerular (GL), external plexiform (EPL), and mitral cell (MCL) layers. b, EPSC evoked in an SMT cell by ON stimulation (13 μA). Like the ET cell in a, the SMT cell had a distinct rapid EPSC, in addition to a slow LLD. This cell had one prominent lateral dendrite (arrowhead on cell image). c, Summary of EPSC onset delays across all MCs (n = 16), ET cells (n = 13), SMT cells (n = 9), and DMT cells (n = 8), plotted as a cumulative histogram. Each data point reflects one cell. d, EPSC rise times (10–90%) across all recordings. e, Amplitudes of putative OSN-EPSCs across all recordings, estimated from the peak (Amp4 ms) measured during the first 4 ms after ON stimulation. f, A dendritic recording of the MC response to ON stimulation (100 μs, 27 μA; at white arrowhead on cell image) did not reveal a substantial fast OSN-EPSC. g, All cell types showed similar-sized LLDs (measured ≥30 ms after ON stimulation), also consistent with at most modest passive filtering effects by the trunk of the apical dendrites.
Figure 2.
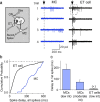
Direct OSN inputs fail to elicit spikes in MCs. a, Simultaneous LCA patch recordings of spike activity in a same-glomerulus MC/ET cell pair. In the four displayed trials, the ET cell spiked just after ON stimulation (30 μA), as well as later in the response, whereas the MC had only delayed spikes. b, Cumulative histogram of spike onset delays (all spikes) for the recording in a. Note that, in the MC, all spikes are delayed, but ET cells have two distinct populations, both early spikes as well as late spikes that occur with the same time course as the MC spikes. c, The delay to first spike was consistently much shorter in ET cells compared with MCs. The indicated stimulus strengths were defined by the probability that an LLD was evoked, low (10–40 μA) when stimuli were perithreshold for generating an LLD and moderate (18–70 μA) when LLDs occurred in all trials. Whether an LLD was elicited was determined indirectly from whether stimuli evoked a long-lasting spike burst in the MC (Gire and Schoppa, 2009). Error bars indicate SE. *p < 0.05.
Figure 3.
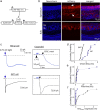
Kinetic analysis of OSN signaling driven by photoactivation of channelrhodopsin-2. a, Schematic representation of the strategy used to express ChR2-mCherry in OSNs. The transgene, tetO-ChR2-mCherry, can be activated in sensory neurons by expression of tTA from the OMP-IRES-tTA locus. b, Expression of ChR2-mCherry in the olfactory epithelium (top panels) and ON and glomerular layers of the OB (bottom panels). In the epithelium, ChR2 can be seen expressed in the dendritic cilia of OSNs (white arrow in mCherry panel) as well as in their basal axon bundles (arrowhead). Glomeruli in OB are demarcated by surrounding Neurotrace-stained cell bodies. c, Photocurrents in a MC (top) and SMT cell (bottom) evoked by a 2 ms pulse of 470 nm light. In the SMT cell, but not the MC, there was a distinct fast current occurring with a short onset. All traces in Figures 3 and 4 are averages of 6–10 responses. d–f, Summary of EPSC measurements across 11 MCs and 13 SMT cells. Plotted are onset delays, 10–90% rise times, and measurements of Amp4 ms. The onset delays in d and Amp4 ms values in f were timed with respect to the start of the 2 ms light pulse. Significant differences (p < 0.01) were observed between MCs and SMT cells for onset delays and Amp4 ms values, but not for rise times (p = 0.13).
Figure 4.
Test of direct OSN signaling: sensitivity of light-evoked currents to tetrodotoxin. a, Synaptic currents in a MC (left) and SMT cell (right) evoked by a 2 ms light pulse before and after application of TTx (1 μ
m
). The current was abolished in the MC but not the SMT cell. In both experiments, the test solution included not only TTx but also 4-AP (100 μ
m
) and
d
-AP5 (50 μ
m
). b, Summary of the ratio of peak current amplitude and charge integral measured in TTx versus the control solution. Current and charge measurements were made in a 20 ms window following the start of the light pulse (a, dashed boxes). c, Summary of peak residual current amplitudes in TTx for MCs (n = 10) and SMT cells (n = 13). Each data point reflects one experiment. Error bars indicate SE. *p < 0.05.
Figure 5.
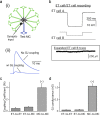
Mitral cells and tufted cells exhibit strong differences in electrical coupling. a, Electrical coupling at MC apical dendrites reduces EPSPs in a 10-MC network model. In the simulations, an excitatory input (decay τ = 2 ms) was placed 5 μm from the end of the 200 μm apical dendrite of the test MC; gap junctions were placed at the end of the apical dendrites of all MCs. Every MC in the model was connected to every other MC with a gap junction conductance of 1.1 nS, the mean value observed experimentally (see Materials and Methods for additional details). b, Electrical coupling measured in an ET cell/ET cell pair in response to hyperpolarization of one ET cell (400 ms pulse of −200 pA to ET cell A). The coupling coefficient for this experiment, determined from the ratio of the hyperpolarizations in the two cells (ET cell B vs ET cell A), was ∼0.1%. c, The average coupling coefficients in ET cell/ET cell pair recordings and ET cell/MC pair recordings were much smaller than the ∼4% value measured in MC/MC pair recordings [from the study by Schoppa and Westbrook (2002)]. d, The differences in electrical coupling among ET cells and MCs corresponded to dramatic differences in gap junctional conductance estimates. Error bars indicate SE. *p < 0.05.
Figure 6.
Cx36-mediated gap junctions shunt direct OSN signals on MCs. a, Example recordings (averages of 10–15 responses) from a MC in Cx36 KO mice (top) and WT mice (bottom). Note that, in KO mice, MCs have a large, rapid current absent in WT mice. b, Recording from an SMT cell from WT mice. c–e, Summary of EPSC measurements across 10 MCs in Cx36 KO mice, 11 MCs in WT mice, and 7 tufted cells (3 ET, 4 SMT cells) in WT mice. Plotted are onset delays (c), 10–90% rise times (d), and Amp4 ms values (e). f, OSNs directly drive spikes in MCs in Cx36 KO mice. fi shows four superimposed trials in MCs from KO mice (top) that included rapid-occurring spikes, absent in WT mice (bottom). The distribution of spike times in KO mice (fii) had a clear rapid component (open arrow). g, Cx36 KO did not significantly affect the amplitude of the OSN-EPSC in tufted cells, suggesting that OSN connectivity was not dramatically affected by KO. Error bars indicate SE.
Figure 7.
ET cells mediate strong multistep excitation of MCs. a, Voltage-clamp recording of MC excitatory currents evoked by ET cell stimulation (400 pA, 25 ms pulse) in an ET cell/MC pair. Four responses that were below threshold for generating an LLD are shown superimposed. This MC also displayed large LLDs in other trials (example in box). Traces of ET cell voltage are shown at bottom. b, Summary of MC EPSCs evoked by ET cell stimulation, including both large LLD and small sub-LLD responses (n = 5). Histogram also includes the amplitude of the ET cell response to MC stimulation (MC-to-ET; n = 8), showing that ET-to-MC transmission is unidirectional. c, d, Simultaneous recordings of responses to ON stimulation (16 μA) in a same-glomerulus ET cell/MC pair. In the two displayed trials in c, inward excitatory current events in the MC are locked to single spikes in the ET cell (recorded in LCA patch mode; see dashed boxes). The spike-locked EPSC is also evident in the averaged traces in d (n = 35), which is shown along with a control trace taken from shuffled trials. The onset latency of the MC current was measured by extrapolating a line fitted to the current rising phase to baseline. Error bars indicate SE.
Figure 8.
Diffuse ET-to-MC signaling. a, Possible mechanism of ET-to-MC signaling in glomeruli: ET cells release glutamate from their dendrites, which acts on extrasynaptic glutamate receptors on MCs. b, The low-affinity competitive glutamate receptor antagonist γ-DGG (500 μ
m
) reversibly reduced the EPSC in a MC (sub-LLD response) evoked by direct stimulation of an ET cell at the same glomerulus (500 pA, 50 ms pulse). γ-DGG (500 μ
m
), however, did not impact the EPSC in an ET cell evoked by stimulation of OSNs (20 μA, 100 μs; in box). All traces in figure are averages of five responses. c, Summary of γ-DGG effects on various EPSCs, including the MC EPSC evoked by direct ET cell stimulation (left bar), the ET cell EPSC evoked by OSN stimulation (middle bar), and the MC EPSC evoked by OSN stimulation (right bar). All MC EPSCs analyzed were sub-LLD responses. d, The EPSC in a MC evoked by OSN stimulation was strongly reduced by γ-DGG. Error bars indicate SE. *p < 0.05.
Similar articles
- Metabotropic glutamate receptors promote disinhibition of olfactory bulb glomeruli that scales with input strength.
Zak JD, Whitesell JD, Schoppa NE. Zak JD, et al. J Neurophysiol. 2015 Mar 15;113(6):1907-20. doi: 10.1152/jn.00222.2014. Epub 2014 Dec 31. J Neurophysiol. 2015. PMID: 25552635 Free PMC article. - Three-dimensional synaptic analyses of mitral cell and external tufted cell dendrites in rat olfactory bulb glomeruli.
Bourne JN, Schoppa NE. Bourne JN, et al. J Comp Neurol. 2017 Feb 15;525(3):592-609. doi: 10.1002/cne.24089. Epub 2016 Aug 18. J Comp Neurol. 2017. PMID: 27490056 Free PMC article. - CCKergic Tufted Cells Differentially Drive Two Anatomically Segregated Inhibitory Circuits in the Mouse Olfactory Bulb.
Sun X, Liu X, Starr ER, Liu S. Sun X, et al. J Neurosci. 2020 Aug 5;40(32):6189-6206. doi: 10.1523/JNEUROSCI.0769-20.2020. Epub 2020 Jun 30. J Neurosci. 2020. PMID: 32605937 Free PMC article. - Calcium signaling in mitral cell dendrites of olfactory bulbs of neonatal rats and mice during olfactory nerve Stimulation and beta-adrenoceptor activation.
Yuan Q, Mutoh H, Debarbieux F, Knöpfel T. Yuan Q, et al. Learn Mem. 2004 Jul-Aug;11(4):406-11. doi: 10.1101/lm.75204. Learn Mem. 2004. PMID: 15286182 Free PMC article. - Differences in Glomerular-Layer-Mediated Feedforward Inhibition onto Mitral and Tufted Cells Lead to Distinct Modes of Intensity Coding.
Geramita M, Urban NN. Geramita M, et al. J Neurosci. 2017 Feb 8;37(6):1428-1438. doi: 10.1523/JNEUROSCI.2245-16.2016. Epub 2016 Dec 27. J Neurosci. 2017. PMID: 28028200 Free PMC article.
Cited by
- An arterially perfused nose-olfactory bulb preparation of the rat.
Pérez de los Cobos Pallarés F, Stanić D, Farmer D, Dutschmann M, Egger V. Pérez de los Cobos Pallarés F, et al. J Neurophysiol. 2015 Sep;114(3):2033-42. doi: 10.1152/jn.01048.2014. Epub 2015 Jun 24. J Neurophysiol. 2015. PMID: 26108959 Free PMC article. - Role of intraglomerular circuits in shaping temporally structured responses to naturalistic inhalation-driven sensory input to the olfactory bulb.
Carey RM, Sherwood WE, Shipley MT, Borisyuk A, Wachowiak M. Carey RM, et al. J Neurophysiol. 2015 May 1;113(9):3112-29. doi: 10.1152/jn.00394.2014. Epub 2015 Feb 25. J Neurophysiol. 2015. PMID: 25717156 Free PMC article. - Rapid Feedforward Inhibition and Asynchronous Excitation Regulate Granule Cell Activity in the Mammalian Main Olfactory Bulb.
Burton SD, Urban NN. Burton SD, et al. J Neurosci. 2015 Oct 21;35(42):14103-22. doi: 10.1523/JNEUROSCI.0746-15.2015. J Neurosci. 2015. PMID: 26490853 Free PMC article. - Effect of Interglomerular Inhibitory Networks on Olfactory Bulb Odor Representations.
Zavitz D, Youngstrom IA, Borisyuk A, Wachowiak M. Zavitz D, et al. J Neurosci. 2020 Jul 29;40(31):5954-5969. doi: 10.1523/JNEUROSCI.0233-20.2020. Epub 2020 Jun 19. J Neurosci. 2020. PMID: 32561671 Free PMC article. - Role of Rb during Neurogenesis and Axonal Guidance in the Developing Olfactory System.
Jaafar C, Omais S, Al Lafi S, El Jamal N, Noubani M, Skaf L, Ghanem N. Jaafar C, et al. Front Mol Neurosci. 2016 Sep 9;9:81. doi: 10.3389/fnmol.2016.00081. eCollection 2016. Front Mol Neurosci. 2016. PMID: 27667971 Free PMC article.
References
- Aroniadou-Anderjaska V, Zhou FM, Priest CA, Ennis M, Shipley MT. Tonic and synaptically evoked presynaptic inhibition of sensory input to the rat olfactory bulb via GABAB heteroreceptors. J Neurophysiol. 2000;84:1194–1203. - PubMed
- Chen WR, Midtgaard J, Shepherd GM. Forward and backward propagation of dendritic impulses and their synaptic control in mitral cells. Science. 1997;278:463–467. - PubMed
Publication types
MeSH terms
Grants and funding
- F31 DC009118/DC/NIDCD NIH HHS/United States
- EY014127/EY/NEI NIH HHS/United States
- 2T32 NS0077083/NS/NINDS NIH HHS/United States
- R01 DC006640/DC/NIDCD NIH HHS/United States
- R01 EY014127/EY/NEI NIH HHS/United States
- K99 DC009839/DC/NIDCD NIH HHS/United States
LinkOut - more resources
Full Text Sources
Other Literature Sources
Molecular Biology Databases
Miscellaneous


