Single-cell exome sequencing reveals single-nucleotide mutation characteristics of a kidney tumor - PubMed (original) (raw)
. 2012 Mar 2;148(5):886-95.
doi: 10.1016/j.cell.2012.02.025.
Yong Hou, Xuyang Yin, Li Bao, Aifa Tang, Luting Song, Fuqiang Li, Shirley Tsang, Kui Wu, Hanjie Wu, Weiming He, Liang Zeng, Manjie Xing, Renhua Wu, Hui Jiang, Xiao Liu, Dandan Cao, Guangwu Guo, Xueda Hu, Yaoting Gui, Zesong Li, Wenyue Xie, Xiaojuan Sun, Min Shi, Zhiming Cai, Bin Wang, Meiming Zhong, Jingxiang Li, Zuhong Lu, Ning Gu, Xiuqing Zhang, Laurie Goodman, Lars Bolund, Jian Wang, Huanming Yang, Karsten Kristiansen, Michael Dean, Yingrui Li, Jun Wang
Affiliations
- PMID: 22385958
- PMCID: PMC7458411
- DOI: 10.1016/j.cell.2012.02.025
Single-cell exome sequencing reveals single-nucleotide mutation characteristics of a kidney tumor
Xun Xu et al. Cell. 2012.
Abstract
Clear cell renal cell carcinoma (ccRCC) is the most common kidney cancer and has very few mutations that are shared between different patients. To better understand the intratumoral genetics underlying mutations of ccRCC, we carried out single-cell exome sequencing on a ccRCC tumor and its adjacent kidney tissue. Our data indicate that this tumor was unlikely to have resulted from mutations in VHL and PBRM1. Quantitative population genetic analysis indicates that the tumor did not contain any significant clonal subpopulations and also showed that mutations that had different allele frequencies within the population also had different mutation spectrums. Analyses of these data allowed us to delineate a detailed intratumoral genetic landscape at a single-cell level. Our pilot study demonstrates that ccRCC may be more genetically complex than previously thought and provides information that can lead to new ways to investigate individual tumors, with the aim of developing more effective cellular targeted therapies.
Copyright © 2012 Elsevier Inc. All rights reserved.
Figures
Figure 1.. Somatic Mutant Allele Frequency from the Individual Patient that Contained Known Variants in the Large ccRCC Cohort of 98 Patients in Guo et al. (2012).
Mutant sites selected in cancer tissue here are covered by more than ten normal reads without any mutations in the normal tissue. The vertical axis showed the average somatic mutant allele frequency in a gene. The horizontal axis showed that mutant sites contained genes, which also present in the 98 patient cohort ranked by alphabet. The area of the circle represents the observed mutation frequency in the 98 patient cohort of each gene. AHNAK, SRGAP3, and PBRM1 were highlighted in red. For further description of the genetic analysis of cancer and normal tissue sequencing data, see also Table 1, Figure S1, and Figure S2.
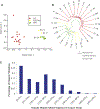
Figure 2.. Somatic Mutation and Single-Cell Population Analysis in This ccRCC Patient.
(A) Principle component analysis (PCA) of cancer cells (RC, red), normal control cells (RN, green), and normal cells picked as cancer cells (RCPM, yellow) based on principle component analysis (PCA). (B) Neighbor joining phylogenetic tree constructed using sites of somatic mutation data by Euclidean distance; cancer cells (RC, red), normal control cells (RN, green), and normal cells picked as cancer cells (RCPM, yellow) are presented here. RN-T here represents the normal tissue DNA as control. After filtering the three normal cells picked as cancer cells, we identified 229 somatic mutations (see Table S3 for details). (C) Mutant allele frequency spectrum somatic mutations in 17 cancer cells. Based on Fisher’s exact test, we separated the mutations into common mutations and rare mutations (see Table S3 for details). For single-cell data evaluation and details of somatic mutation calling, see also Figures S3, S4, S5, and S6 and Tables S2, S3, S4.
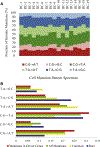
Figure 3.. Somatic Mutation Pattern Spectrums.
(A) Somatic mutation pattern spectrum of individual ccRCC cells. (B) Somatic mutation pattern spectrum of rare mutations (blue) and common mutations (yellow) compared with spectrum of driver mutations (red) and all nonsynonymous mutations (green) in the 98 patient cohort. See also Table S4.
Figure 4.. Intratumoral Gene Mutation Landscape of an Individual ccRCC Patient.
Nonsynonymous somatic mutations are plotted in two-dimensional space, which represents chromosomal positions of mutant genes. Chromosomal positions and mutant genes were ranked as indicated by arrows beside the plane. Each mutant gene is scaled by a relative position (0–1) on its chromosome; thus, its position on different chromosomes was normalized by its total length. Higher peaks (purple) —peak heights assigned a value of mutant reads ratio—indicate the 28 identified mountain genes. The shorter peaks (green), with peak heights assigned a value of mutant reads ratio, show the 66 identified hill genes. Genes recurrently mutated in the large patient cohort are marked in red (mountain) and blue (hill). See also Table S5 for details.
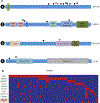
Figure 5.. Analysis of Genes of This Patient that Were Recurrently Mutated in the ccRCC Patient Cohort.
Analysis includes 98 patients from Guo et al. (2012) and the patient of this single-cell exome sequencing study. (A) Somatic mutations in AHNAK, LRRK2, SRGAP3, and USP6. The types and relative positions of confirmed somatic mutations are shown in the transcripts of AHNAK (1), LRRK2 (2), SRGAP3 (3), and USP6 (4) using the following symbols: red stars, nonsense mutations; bullets, missense mutations. Domains and motifs in each encoded protein product are indicated. ARM-like, Armadillo-like helical; MIRO-like, mitochondrial Rho-like; Se/Thr Kinase-like domain, serine/threonine protein kinase-like domain; WD40 repeat-like, WD40/YVTN repeat-like-containing domain; FCH, Fps/Fes/Fer/CIP4 homology; RhoGAP domain, Rho GTPase-activating protein domain; SH3 domain, Src homology 3 domain; RabGAP/TBC, Rab-GAP/TBC domain; Peptidase C19, ubiquitin carboxyl-terminal hydrolase 2. See also Table 2 for details. (B) Concurrent and mutually exclusive mutations observed in the genes known to be frequently mutated in this cohort. For each gene (row) indicated, tumors (columns) with or without mutations are labeled in red or blue, respectively. We selected only genes harboring nonsilent mutations in at least five subjects for this analysis.
Comment in
- Words of wisdom. Re: Intratumor heterogeneity and branched evolution revealed by multiregion sequencing.
Tannock IF. Tannock IF. Eur Urol. 2014 Apr;65(4):846-7. doi: 10.1016/j.eururo.2013.12.033. Eur Urol. 2014. PMID: 24559903 No abstract available.
Similar articles
- PBRM1 and BAP1 as novel targets for renal cell carcinoma.
Brugarolas J. Brugarolas J. Cancer J. 2013 Jul-Aug;19(4):324-32. doi: 10.1097/PPO.0b013e3182a102d1. Cancer J. 2013. PMID: 23867514 Free PMC article. - PBRM1 and VHL expression correlate in human clear cell renal cell carcinoma with differential association with patient's overall survival.
Högner A, Krause H, Jandrig B, Kasim M, Fuller TF, Schostak M, Erbersdobler A, Patzak A, Kilic E. Högner A, et al. Urol Oncol. 2018 Mar;36(3):94.e1-94.e14. doi: 10.1016/j.urolonc.2017.10.027. Epub 2017 Nov 21. Urol Oncol. 2018. PMID: 29169846 - Specific genomic aberrations predict survival, but low mutation rate in cancer hot spots, in clear cell renal cell carcinoma.
Köhn L, Svenson U, Ljungberg B, Roos G. Köhn L, et al. Appl Immunohistochem Mol Morphol. 2015 May-Jun;23(5):334-42. doi: 10.1097/PAI.0000000000000087. Appl Immunohistochem Mol Morphol. 2015. PMID: 24992170 Free PMC article. - The roles of chromatin-remodelers and epigenetic modifiers in kidney cancer.
Liao L, Testa JR, Yang H. Liao L, et al. Cancer Genet. 2015 May;208(5):206-14. doi: 10.1016/j.cancergen.2015.02.008. Epub 2015 Feb 20. Cancer Genet. 2015. PMID: 25873528 Free PMC article. Review. - A clearer view of the molecular complexity of clear cell renal cell carcinoma.
Frew IJ, Moch H. Frew IJ, et al. Annu Rev Pathol. 2015;10:263-89. doi: 10.1146/annurev-pathol-012414-040306. Epub 2014 Oct 27. Annu Rev Pathol. 2015. PMID: 25387056 Review.
Cited by
- Biological and Medical Importance of Cellular Heterogeneity Deciphered by Single-Cell RNA Sequencing.
Gupta RK, Kuznicki J. Gupta RK, et al. Cells. 2020 Jul 22;9(8):1751. doi: 10.3390/cells9081751. Cells. 2020. PMID: 32707839 Free PMC article. Review. - Cancer in light of experimental evolution.
Sprouffske K, Merlo LM, Gerrish PJ, Maley CC, Sniegowski PD. Sprouffske K, et al. Curr Biol. 2012 Sep 11;22(17):R762-71. doi: 10.1016/j.cub.2012.06.065. Curr Biol. 2012. PMID: 22975007 Free PMC article. Review. - Dive into Single, Seek Out Multiple: Probing Cancer Metastases via Single-Cell Sequencing and Imaging Techniques.
Su S, Li X. Su S, et al. Cancers (Basel). 2021 Mar 3;13(5):1067. doi: 10.3390/cancers13051067. Cancers (Basel). 2021. PMID: 33802312 Free PMC article. Review. - TRA-1-60+, SSEA-4+, POU5F1+, SOX2+, NANOG+ Clones of Pluripotent Stem Cells in the Embryonal Carcinomas of the Testes.
Malecki M, Tombokan X, Anderson M, Malecki R, Beauchaine M. Malecki M, et al. J Stem Cell Res Ther. 2013 Apr 2;3(1):1000134. doi: 10.4172/2157-7633.1000134. J Stem Cell Res Ther. 2013. PMID: 23772337 Free PMC article. - Analysis of gene copy number changes in tumor phylogenetics.
Zhou J, Lin Y, Rajan V, Hoskins W, Feng B, Tang J. Zhou J, et al. Algorithms Mol Biol. 2016 Sep 22;11:26. doi: 10.1186/s13015-016-0088-2. eCollection 2016. Algorithms Mol Biol. 2016. PMID: 27688796 Free PMC article.
References
- Beroukhim R, Brunet JP, Di Napoli A, Mertz KD, Seeley A, Pires MM, Linhart D, Worrell RA, Moch H, Rubin MA, et al. (2009). Patterns of gene expression and copy-number alterations in von-hippel lindau disease-associated and sporadic clear cell carcinoma of the kidney. Cancer Res. 69, 4674–4681. - PMC - PubMed
Publication types
MeSH terms
Substances
LinkOut - more resources
Full Text Sources
Other Literature Sources
Medical
Miscellaneous


