REST-mediated recruitment of polycomb repressor complexes in mammalian cells - PubMed (original) (raw)
REST-mediated recruitment of polycomb repressor complexes in mammalian cells
Nikolaj Dietrich et al. PLoS Genet. 2012.
Abstract
Polycomb Repressive Complex (PRC) 1 and PRC2 regulate genes involved in differentiation and development. However, the mechanism for how PRC1 and PRC2 are recruited to genes in mammalian cells is unclear. Here we present evidence for an interaction between the transcription factor REST, PRC1, and PRC2 and show that RNF2 and REST co-regulate a number of neuronal genes in human teratocarcinoma cells (NT2-D1). Using NT2-D1 cells as a model of neuronal differentiation, we furthermore showed that retinoic-acid stimulation led to displacement of PRC1 at REST binding sites, reduced H3K27Me3, and increased gene expression. Genome-wide analysis of Polycomb binding in Rest⁻/⁻ and Eed⁻/⁻ mouse embryonic stem (mES) cells showed that Rest was required for PRC1 recruitment to a subset of Polycomb regulated neuronal genes. Furthermore, we found that PRC1 can be recruited to Rest binding sites independently of CpG islands and the H3K27Me3 mark. Surprisingly, PRC2 was frequently increased around Rest binding sites located in CpG-rich regions in the Rest⁻/⁻ mES cells, indicating a more complex interplay where Rest also can limit PRC2 recruitment. Therefore, we propose that Rest has context-dependent functions for PRC1- and PRC2- recruitment, which allows this transcription factor to act both as a recruiter of Polycomb as well as a limiting factor for PRC2 recruitment at CpG islands.
Conflict of interest statement
The authors have declared that no competing interests exist.
Figures
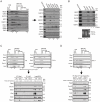
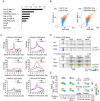
Figure 1. REST and Polycomb Repressor Complex 1 (PRC1) and PRC2 interact in vivo.
(A) Nuclear extracts from NT2-D1 cells were processed for size-exclusion chromatography followed by Western blotting to reveal the profiles of Polycomb proteins, the transcription factors REST and E2F6. Pooled fractions (1: Fractions F7–9; 2: F11–13; 3: F21–22) were used for immunoprecipitation (IP) with anti-REST or control IgG and processed for Western blotting with antibodies as indicated (total lysate: 12 µg of protein). (B) IPs using REST or control IgG on total nuclear extract (NT2-D1 cells; 500 µg per IP). After IPs the samples were either treated with a combination of RNase V1 and RNase A or left without RNase followed by repeated washes. Eluted proteins were processed for Western blotting using antibodies as indicated. Lower panel: Control experiment for the efficiency of RNase treatment using either 2 µg (left part) or 4 µg (right part) of RNA. Samples were incubated under the conditions used for REST IPs. (C–D) Nuclear protein extracts from mouse embryonic stem cells (mES) of different genetic background (Wt, Eed−/− or Rnf2−/−) were separated by size-exclusion chromatography (C–D: upper panels) and pooled fractions (1: F8–10; 2: F11–13; 3: F22) were processed for IPs (C–D: lower panels) using antibodies for Rest or control IgG. Western blots were processed with antibodies as indicated. Input corresponds to 3% of the material used for each IP. (C) Represents IPs comparing Wt and Eed−/− mES cells and (D) represents IPs in the Rnf2−/− mES cells. The samples were processed for Western blotting with antibodies as indicated. Lanes marked “M” represents loading of a pre-stained molecular weight marker.
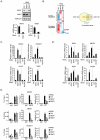
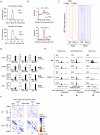
Figure 2. REST is required for PRC1 binding and the maintenance of H3K27Me3.
(A) shRNA mediated knockdown of REST and RNF2 in NT2-D1 cells. Samples were processed for Western blot analysis (upper panel) and quantitative real-time RT-PCR (lower panel). (B) Expression array analysis of RNA isolated from NT2-D1 cells treated with a control shRNA or a shRNA against either REST or RNF2. Left panel: Cluster analysis of regulated genes displayed as a heat-map. Right panel: Venn diagram for genes up-regulated more than 2 fold and a P-value<0.05. In C and D relative mRNA levels in NT2-D1 cells treated with shRNA against REST, RNF2, or RCOR1 are shown. Vertical punctured line separate two independent experiments (knockdown of REST and RNF2 were done in parallel and knockdown of RCOR1 was done separately). (C) Group of genes repressed by REST and RNF2. (D) Group of genes repressed by REST, RNF2 and/or CoREST. (E) ChIP analysis on NT2-D1 cells treated with shRNA against REST and RNF2 using antibodies as indicated (K27 = H3K27Me3). Error bars represent standard deviations calculated from triplicate qPCR reactions.
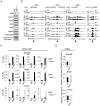
Figure 3. Rest regulates recruitment of PRC1 and PRC2 at specific genomic loci.
(A) Western blot analysis of Wt and _Rest_−/− mES cell lysates. Histones were extracted using LSB. (B) ChIP-seq profiles for Rnf2, Suz12 and H3K27Me3 levels in Wt and Rest−/− mES cells for three Rest target genes (Brunol6, Best2 and Prrxl1) and as control, one Polycomb target gene with no Rest binding site (Gjb2). Direct ChIP for the three Rest target genes shown in (B) comparing Wt and Rest−/− mES cells (primer positions are indicated by arrow heads in B and K27 = H3K27Me3) and mRNA levels (C). Error bars represent standard deviations calculated from triplicate qPCR reactions.
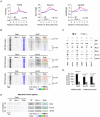
Figure 4. Occupancy of PRC1 and PRC2 at Rest peaks in Wt and _Rest_−/− mES cells.
(A) Average ChIP-seq read counts in Wt control and _Rest_−/− mES cells, normalized to IgG controls for Rnf2, Suz12 and Jarid2 within 3 Kb of the 3,378 peaks identified for Rest in the Wt control cells. Black arrow indicates the direction of the nearest TSS. (B) Heat-maps showing Rnf2, Suz12 and Jarid2 occupancy in a 2 Kb window centered around individual Rest peaks identified in Wt control mES cells. The ratiometric heat-maps depict the part of the profiles that were increased, unaffected, or decreased in Rest−/− mES cells as red, green and blue, respectively. Out of the 3,378 Rest peak positions identified in the Wt control mES cells, positions with very low levels or no PcG (Rnf2, Suz12 and Jarid2) ChIP-seq signal in either Wt control or Rest−/− mES cells were filtered out (for thresholds and genomic peak positions see Table S3). The regions were sorted according to the fold change in PcG (Rnf2, Suz12 and Jarid2) signal between the Wt control and Rest−/− mES cells, within the Rest peaks. P-values were calculated by comparing the number of Rest binding sites with 1.5 fold increase or decrease to those expected from a population with similar distribution as the matched control using chi2-tests (C) ChIP-seq profiles for the positions marked 1 to 6 in Figure 4B as examples. Data from Wt and Rest−/− mES cells are shown in black and grey, respectively (K27 = H3K27Me3). (D) Diagram showing the number of Rest peaks and matched control regions (no Rest peaks) scored positive for Rnf2, Suz12 or Jarid2 signal. The filtering process described in the legend for Figure 4B. P-values compares binding sites scoring positive for PcG binding to those that scored positive by chance in the matched control regions using chi2-tests (E) Heat-maps of the matched control regions shown in 4D.
Figure 5. Effects of different parameters on Rnf2 binding.
(A) Graph showing the Pearson's correlation coefficients (r2) of the change in Rnf2 at Rest peaks correlated to different parameters as indicated (the data were log-transformed before the correlation was done). (B) Scatter diagram showing the Rnf2 signal for the Rest peaks with either relative low (blue color) or high (red color) levels of Suz12 (left panel) or H3K27Me3 (right panel) in the Wt versus Rest−/− mES cells. The Rnf2 positive Rest peaks shown in Figure 4B were separated into two groups having either relative low (blue color: <5 reads on average within 1 Kb of the Rest peak) or relative high (red color: >5 reads on average within 1 Kb of the Rest peak) ChIP-seq signals for Suz12 and H3K27Me3. (C) Average ChIP-seq read counts for Rnf2, Suz12 and Jarid2 in Wt and Rest_−/− mES cells normalized to IgG controls. The regions were subdivided into two groups, depending on whether or not a CpG island was located within 1 Kb of the borders of the Rest peaks. Only regions with a direct overlap between Rest and Rnf2 peaks in the Wt control mES cells were included (Table S4). (D) Heat-maps of Rnf2, Suz12 and Jarid2 for the individual peak positions analysed in C. The regions were sorted according to the fold change in PcG (Rnf2, Suz12 and Jarid2) signal between the Wt control and Rest−/− mES cells, within the Rest peaks. The ratiometric region map depicts the part of the profiles that were increased, unaffected, or decreased in Rest−/− mES cells as red, green and blue, respectively. (E) Color-coded density plots showing the difference in Rnf2 ChIP-seq signal in Wt and Rest−/− mES cells relative to the distance to TSS, distance to the nearest CpG-island, and the Suz12-signal at the 395 Rest peak positions that were scored Rnf2-positive. Densities, within each bin, depend on the number of peaks, whereas the color-coding corresponds to the average Rnf2_Rest−/−/Rnf2_Wt_ ratio with red, green and blue illustrating increased, unaffected, or decreased signal, respectively. Peaks were binned in 1.5 fold bins for Suz12 and 2 fold bins for the TSS or CpG position. The flanking histograms in the top and right part of the figure illustrate the number of peaks in each bin. P-values were calculated using heteroschedastic Student's t-tests.
Figure 6. The recruitment of PRC1 at a number of Rest binding sites is independent of PRC2 activity in mES cells.
(A) Histograms showing the number of Rnf2 peaks in Wt and _Eed_−/− mES cells at positions relative to CpG islands. Upper panel: Rnf2 peaks that overlap with CpG-islands relative to the distance between the center of the peak and the center of the CpG-island. Lower panel: Rnf2 peaks, not overlapping with annotated CpG-islands, plotted relative to the distance between the borders of the Rnf2 peak and the border of the CpG-island. (B) Average ChIP-seq reads in E14 Wt and _Eed_−/− for Rnf2 (upper panel) and Rest (lower panel) within 3 Kb of the 5,097 Rest peaks identified in E14 Wt mES cells (Table S5). Read counts were normalized to the IgG control. The black arrow indicates the direction of the nearest TSS. (C) Heat-maps of Rest and Rnf2 in Wt and _Eed_−/− mES cells at 1,907 Rest peaks within 10 Kb of a TSS. (D) Direct ChIP in E14 Wt and _Eed_−/− mES cells for Calb1, Nudt9, Gpc2/Stag3 and Gjb2 (positions of primers used are indicated by arrow heads in E). Error bars represent standard deviations calculated from triplicate qPCR reactions. (E) ChIP-seq profiles for the Nudt9, Gpc2/Stag3 and Gjb2 loci using antibodies for Rnf2, Rest and control IgG. (F) Co-occurrence matrix of Rest and Rnf2 peaks from Wt and Eed−/− mES cells. The maps are based on scans, with a 2,500 bp window, along different positions near the transcription start site (TSS) or transcription end points (TE) annotated in the mouse genome (Mouse genome: mm9). For each scan the number of observed peaks were calculated and normalized to the number of expected peaks based on the frequency of Rest and Rnf2 peaks in that particular position, relative to the TSS or TE. Scans with a higher or lower frequency than expected from random localization, were colored blue or red, respectively. Scans with a P-value below 0.05 (Bonferroni corrected for multiple sampling), are overlaid with transparent green color.
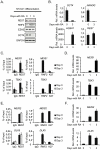
Figure 7. Neuronal differentiation in NT2-D1 cells.
NT2-D1 cells were treated with Retinoic Acid (RA) for 1 and 3 days or left untreated (day 0). Protein-, RNA- and ChIP-samples were harvested. (A) Western blot analysis of protein samples taken at day 0, 1 and 3. (B) Relative mRNA levels at day 0 and 3 of REST, OCT4 and NANOG and HOXA1. (C) Group of genes, which loose binding of both REST and PcG proteins during differentiation. ChIP analysis was performed for day 0 and 3 of RA treatment. (D) Relative mRNA levels of the genes displayed in (C), for untreated cells and cells treated with RA for 3 days. (E) Group of genes, which maintain REST binding but loose PcG proteins during differentiation. ChIP analysis at day 0 and 3 after RA treatment. (F) Relative mRNA levels of the genes displayed in (E) after 0 and 3 days of RA treatment. Error bars represent standard deviations calculated from triplicate qPCR reactions.
Similar articles
- Polycomb-like 3 promotes polycomb repressive complex 2 binding to CpG islands and embryonic stem cell self-renewal.
Hunkapiller J, Shen Y, Diaz A, Cagney G, McCleary D, Ramalho-Santos M, Krogan N, Ren B, Song JS, Reiter JF. Hunkapiller J, et al. PLoS Genet. 2012;8(3):e1002576. doi: 10.1371/journal.pgen.1002576. Epub 2012 Mar 15. PLoS Genet. 2012. PMID: 22438827 Free PMC article. - Polycomb complex recruitment in pluripotent stem cells.
Barrero MJ, Izpisua Belmonte JC. Barrero MJ, et al. Nat Cell Biol. 2013 Apr;15(4):348-50. doi: 10.1038/ncb2723. Nat Cell Biol. 2013. PMID: 23548929 - Variant PRC1 complex-dependent H2A ubiquitylation drives PRC2 recruitment and polycomb domain formation.
Blackledge NP, Farcas AM, Kondo T, King HW, McGouran JF, Hanssen LLP, Ito S, Cooper S, Kondo K, Koseki Y, Ishikura T, Long HK, Sheahan TW, Brockdorff N, Kessler BM, Koseki H, Klose RJ. Blackledge NP, et al. Cell. 2014 Jun 5;157(6):1445-1459. doi: 10.1016/j.cell.2014.05.004. Epub 2014 May 22. Cell. 2014. PMID: 24856970 Free PMC article. - Polycomb repressive complex 2 in embryonic stem cells: an overview.
Jones A, Wang H. Jones A, et al. Protein Cell. 2010 Dec;1(12):1056-62. doi: 10.1007/s13238-010-0142-7. Epub 2011 Jan 8. Protein Cell. 2010. PMID: 21213100 Free PMC article. Review. - The Polycomb complex PRC2 and its mark in life.
Margueron R, Reinberg D. Margueron R, et al. Nature. 2011 Jan 20;469(7330):343-9. doi: 10.1038/nature09784. Nature. 2011. PMID: 21248841 Free PMC article. Review.
Cited by
- Inhibition of REST Suppresses Proliferation and Migration in Glioblastoma Cells.
Zhang D, Li Y, Wang R, Li Y, Shi P, Kan Z, Pang X. Zhang D, et al. Int J Mol Sci. 2016 May 3;17(5):664. doi: 10.3390/ijms17050664. Int J Mol Sci. 2016. PMID: 27153061 Free PMC article. - The genetic and epigenetic journey of embryonic stem cells into mature neural cells.
Olynik BM, Rastegar M. Olynik BM, et al. Front Genet. 2012 May 18;3:81. doi: 10.3389/fgene.2012.00081. eCollection 2012. Front Genet. 2012. PMID: 22629283 Free PMC article. - ATRX In-Frame Fusion Neuroblastoma Is Sensitive to EZH2 Inhibition via Modulation of Neuronal Gene Signatures.
Qadeer ZA, Valle-Garcia D, Hasson D, Sun Z, Cook A, Nguyen C, Soriano A, Ma A, Griffiths LM, Zeineldin M, Filipescu D, Jubierre L, Chowdhury A, Deevy O, Chen X, Finkelstein DB, Bahrami A, Stewart E, Federico S, Gallego S, Dekio F, Fowkes M, Meni D, Maris JM, Weiss WA, Roberts SS, Cheung NV, Jin J, Segura MF, Dyer MA, Bernstein E. Qadeer ZA, et al. Cancer Cell. 2019 Nov 11;36(5):512-527.e9. doi: 10.1016/j.ccell.2019.09.002. Epub 2019 Oct 17. Cancer Cell. 2019. PMID: 31631027 Free PMC article. - Endotype Characterization Reveals Mechanistic Differences Across Brain Regions in Sporadic Alzheimer's Disease.
Patel AO, Caldwell AB, Ramachandran S, Subramaniam S. Patel AO, et al. J Alzheimers Dis Rep. 2023 Aug 29;7(1):957-972. doi: 10.3233/ADR-220098. eCollection 2023. J Alzheimers Dis Rep. 2023. PMID: 37849634 Free PMC article.
References
- Schuettengruber B, Cavalli G. Recruitment of polycomb group complexes and their role in the dynamic regulation of cell fate choice. Development. 2009;136:3531–3542. - PubMed
- Cao R, Wang L, Wang H, Xia L, Erdjument-Bromage H, et al. Role of histone H3 lysine 27 methylation in Polycomb-group silencing. Science. 2002;298:1039–1043. - PubMed
- Czermin B, Melfi R, McCabe D, Seitz V, Imhof A, et al. Drosophila enhancer of Zeste/ESC complexes have a histone H3 methyltransferase activity that marks chromosomal Polycomb sites. Cell. 2002;111:185–196. - PubMed
- Muller J, Hart CM, Francis NJ, Vargas ML, Sengupta A, et al. Histone methyltransferase activity of a Drosophila Polycomb group repressor complex. Cell. 2002;111:197–208. - PubMed
Publication types
MeSH terms
Substances
LinkOut - more resources
Full Text Sources
Other Literature Sources
Molecular Biology Databases
Miscellaneous
