Trpc1 ion channel modulates phosphatidylinositol 3-kinase/Akt pathway during myoblast differentiation and muscle regeneration - PubMed (original) (raw)
Trpc1 ion channel modulates phosphatidylinositol 3-kinase/Akt pathway during myoblast differentiation and muscle regeneration
Nadège Zanou et al. J Biol Chem. 2012.
Abstract
We previously showed in vitro that calcium entry through Trpc1 ion channels regulates myoblast migration and differentiation. In the present work, we used primary cell cultures and isolated muscles from Trpc1(-/-) and Trpc1(+/+) murine model to investigate the role of Trpc1 in myoblast differentiation and in muscle regeneration. In these models, we studied regeneration consecutive to cardiotoxin-induced muscle injury and observed a significant hypotrophy and a delayed regeneration in Trpc1(-/-) muscles consisting in smaller fiber size and increased proportion of centrally nucleated fibers. This was accompanied by a decreased expression of myogenic factors such as MyoD, Myf5, and myogenin and of one of their targets, the developmental MHC (MHCd). Consequently, muscle tension was systematically lower in muscles from Trpc1(-/-) mice. Importantly, the PI3K/Akt/mTOR/p70S6K pathway, which plays a crucial role in muscle growth and regeneration, was down-regulated in regenerating Trpc1(-/-) muscles. Indeed, phosphorylation of both Akt and p70S6K proteins was decreased as well as the activation of PI3K, the main upstream regulator of the Akt. This effect was independent of insulin-like growth factor expression. Akt phosphorylation also was reduced in Trpc1(-/-) primary myoblasts and in control myoblasts differentiated in the absence of extracellular Ca(2+) or pretreated with EGTA-AM or wortmannin, suggesting that the entry of Ca(2+) through Trpc1 channels enhanced the activity of PI3K. Our results emphasize the involvement of Trpc1 channels in skeletal muscle development in vitro and in vivo, and identify a Ca(2+)-dependent activation of the PI3K/Akt/mTOR/p70S6K pathway during myoblast differentiation and muscle regeneration.
Figures
FIGURE 1.
Weight and tension of normal and regenerating muscle in Trpc1+/+ and Trpc1−/− mice. A and B, animal and EDL muscle weights during the first 6 months of life (*, p < 0.05). C, maximal tension (force per cross-sectional area) measured after cardiotoxin-induced injury in EDL muscles at day 14 of regeneration, stimulated during 300 ms and at 125 Hz. *, p < 0.05 versus Trpc1+/+ (Student's t test, n = 6). D, time course of muscle tension in regenerating EDL muscles. Day zero is the day of cardiotoxin injection. Tension of regenerating muscle reported to that of contralateral noninjected muscle. *, p < 0.05 versus Trpc1+/+ (two-way analysis of variance followed by Tukey's test for multiple comparison, n = 6 per day).
FIGURE 2.
Histological characteristics of regenerating muscles after cardiotoxin injection. A, hematoxylin/eosin staining of TA muscles from Trpc1**+/+** and Trpc1−/− mice after cardiotoxin injection. B, detailed views of zones represented at day 10. Shown is a quantification of fiber size areas. *, p < 0.05 versus Trpc1+/+ (Pearson Chi square, n = 6 different mice). C, fiber size at day (D) 10 of regeneration related to contralateral noninjected muscle (*, p < 0.05, n = 6 TA muscles from six different mice, 200 fibers counted per muscle). D, detailed views of zones represented at day 14. The proportion of central nuclei is shown. Arrows indicate central nuclei. ***, p < 0.001 versus Trpc1+/+ (n = 3 different mice, three microscopic fields per muscle of each animal).
FIGURE 3.
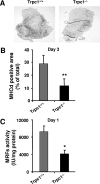
Assessment of the activity of myogenic transcription factors. A, immunodetection of MHCd in TA muscles from Trpc1+/+ and Trpc1−/− mice, 3 days after injury. B, quantification of MHCd positive areas related to total muscle cross-section area. **, p < 0.01 versus Trpc1+/+ (Student's t test, n = 6 different mice per group). C, myogenic transcription factors activity measured using a luciferase-based gene reporter, related to the quantity of muscle protein content. *, p < 0.05 versus Trpc1+/+ (Student's t test, n = 6 different animals).
FIGURE 4.
Expression of myogenic transcription factors in regenerating muscles. A, expression of myogenic factors (Myf5, MyoD, and myogenin) and p27 assessed by Western blot analysis in TA muscles. B, mRNA quantification (quantitative RT-PCR) of myogenic factors in EDL muscles. Δ_Ct_ was calculated by using GAPDH as internal control, and ΔΔ_Ct_ was related to the noninjected muscles in each group. *, p < 0.05 versus Trpc1+/+ at day 1 (two-way analysis of variance followed by Tukey's test for multiple comparison, n = 4 different animals per day).
FIGURE 5.
Akt pathway in regenerating muscles. The level of Akt and p70S6K phosphorylation was quantified in TA muscles at day 3 of regeneration using Western blot analysis and was related to total Akt and p70S6K proteins contents, respectively. **, p < 0.01 versus Trpc1+/+ (A); *, p < 0.05 versus Trpc1+/+ (B); Student's t test (n = 6 different animals).
FIGURE 6.
Involvement of Trpc1 in calcium-mediated primary myoblast differentiation. A, calcium influx in Trpc1+/+ and Trpc1−/− primary myoblasts estimated by using Mn2+-induced Fura-PE3 quenching technique. D0 represents proliferation condition, and D1 represents the first day of differentiation. **, p < 0.01 versus DO in Trpc1+/+ myoblasts; §, p < 0.05 between D1 Trpc1−/− and D1 Trpc1+/+ myoblasts (two-way analysis of variance followed by Bonferroni test for multiple comparison). B, wound healing assay performed in primary cultured myoblasts obtained from Trpc1+/+ and Trpc1−/− mice and maintained 24 h in differentiation medium (DM). C, number of migrating myoblasts 15 h after wounding (related to Trpc1+/+ migrating myoblast). ***, p < 0.001 versus Trpc1+/+ (Student's t test, representative data of three independent experiments). D, representative examples of Trpc1+/+ and Trpc1−/− myoblasts maintained in differentiation medium for 4 days.
FIGURE 7.
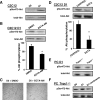
Ca2+ modulation of Akt activation. A, immunodetection of Akt phosphorylation in C2C12 myoblasts maintained in proliferation medium (day 0) or cultured 1 day in differentiation medium (day 1). B, immunodetection of phosphorylated Akt in C2C12 myoblasts treated 24 h with 20 μ
m
EGTA-AM or vehicle only (dimethyl sulfoxide; DMSO), as a fraction of total Akt contents. *, p < 0.05 versus dimethyl sulfoxide; Student's t test (n = four different cultures). C, morphology of C2C12 myotubes after 5 days of differentiation; left panel, myoblasts treated with vehicle only; right panel, myoblasts treated at day 1 with 20 μ
m
EGTA-AM. D, immunodetection of phosphorylated Akt in C2C12 myoblasts maintained 4 h in differentiation medium with or without Ca2+ (200 μ
m
EGTA), as a fraction of total Akt contents. *, p < 0.05 versus control (Student's t test, n = 3 different cultures). E, comparison of phosphorylated Akt at day 1 of differentiation in Trpc1−/− and Trpc1+/+ primary myoblasts. F, immunodetection of phosphorylated Akt of Trpc1+/+ primary myoblasts cultured (PC) in proliferation medium (D0) and after 1 day in differentiation medium in the absence (D1) or in the presence of 100 n
m
wortmannin.
FIGURE 8.
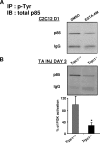
Involvement of Trpc1 in PI3K activation. Immunoprecipitation of phosphotyrosines residues followed by immunoblot of p85 subunit of PI3K (A) in C2C12 myoblasts cultured 1 day in differentiation medium and treated with or without EGTA-AM (B) in Trpc1+/+ and Trpc1−/− TA muscles after 3 days of regeneration. *, p < 0.05 versus Trpc1+/+; Student's t test (n = 6 different mice).
Comment in
- Incomplete degeneration versus enhanced regeneration in skeletal muscle.
Moyer AL, Wagner KR. Moyer AL, et al. J Biol Chem. 2012 Jul 20;287(30):25549; author reply 25550. doi: 10.1074/jbc.L112.380923. J Biol Chem. 2012. PMID: 22821807 Free PMC article. No abstract available.
Similar articles
- Raptor and Rheb negatively regulate skeletal myogenesis through suppression of insulin receptor substrate 1 (IRS1).
Ge Y, Yoon MS, Chen J. Ge Y, et al. J Biol Chem. 2011 Oct 14;286(41):35675-35682. doi: 10.1074/jbc.M111.262881. Epub 2011 Aug 18. J Biol Chem. 2011. PMID: 21852229 Free PMC article. - TRPC1 regulates skeletal myoblast migration and differentiation.
Louis M, Zanou N, Van Schoor M, Gailly P. Louis M, et al. J Cell Sci. 2008 Dec 1;121(Pt 23):3951-9. doi: 10.1242/jcs.037218. Epub 2008 Nov 11. J Cell Sci. 2008. PMID: 19001499 - Incomplete degeneration versus enhanced regeneration in skeletal muscle.
Moyer AL, Wagner KR. Moyer AL, et al. J Biol Chem. 2012 Jul 20;287(30):25549; author reply 25550. doi: 10.1074/jbc.L112.380923. J Biol Chem. 2012. PMID: 22821807 Free PMC article. No abstract available. - PI3 kinase regulation of skeletal muscle hypertrophy and atrophy.
Glass DJ. Glass DJ. Curr Top Microbiol Immunol. 2010;346:267-78. doi: 10.1007/82_2010_78. Curr Top Microbiol Immunol. 2010. PMID: 20593312 Review. - Postnatal skeletal muscle myogenesis governed by signal transduction networks: MAPKs and PI3K-Akt control multiple steps.
Endo T. Endo T. Biochem Biophys Res Commun. 2023 Nov 19;682:223-243. doi: 10.1016/j.bbrc.2023.09.048. Epub 2023 Sep 27. Biochem Biophys Res Commun. 2023. PMID: 37826946 Review.
Cited by
- Carvacrol together with TRPC1 elimination improve functional recovery after traumatic brain injury in mice.
Peters M, Trembovler V, Alexandrovich A, Parnas M, Birnbaumer L, Minke B, Shohami E. Peters M, et al. J Neurotrauma. 2012 Dec 10;29(18):2831-4. doi: 10.1089/neu.2012.2575. Epub 2012 Nov 16. J Neurotrauma. 2012. PMID: 22994850 Free PMC article. - Roles of mTOR Signaling in Tissue Regeneration.
Wei X, Luo L, Chen J. Wei X, et al. Cells. 2019 Sep 12;8(9):1075. doi: 10.3390/cells8091075. Cells. 2019. PMID: 31547370 Free PMC article. Review. - Borax-loaded injectable alginate hydrogels promote muscle regeneration in vivo after an injury.
Ciriza J, Rodríguez-Romano A, Nogueroles I, Gallego-Ferrer G, Cabezuelo RM, Pedraz JL, Rico P. Ciriza J, et al. Mater Sci Eng C Mater Biol Appl. 2021 Apr;123:112003. doi: 10.1016/j.msec.2021.112003. Epub 2021 Mar 3. Mater Sci Eng C Mater Biol Appl. 2021. PMID: 33812623 Free PMC article. - TRPCs: Influential Mediators in Skeletal Muscle.
Choi JH, Jeong SY, Oh MR, Allen PD, Lee EH. Choi JH, et al. Cells. 2020 Apr 1;9(4):850. doi: 10.3390/cells9040850. Cells. 2020. PMID: 32244622 Free PMC article. Review. - Red (635 nm), Near-Infrared (808 nm) and Violet-Blue (405 nm) Photobiomodulation Potentiality on Human Osteoblasts and Mesenchymal Stromal Cells: A Morphological and Molecular In Vitro Study.
Tani A, Chellini F, Giannelli M, Nosi D, Zecchi-Orlandini S, Sassoli C. Tani A, et al. Int J Mol Sci. 2018 Jul 3;19(7):1946. doi: 10.3390/ijms19071946. Int J Mol Sci. 2018. PMID: 29970828 Free PMC article.
References
- Weintraub H. (1993) The MyoD family and myogenesis: Redundancy, networks, and thresholds. Cell 75, 1241–1244 - PubMed
- Buckingham M. (2001) Skeletal muscle formation in vertebrates. Curr. Opin. Genet. Dev. 11, 440–448 - PubMed
- Molkentin J. D., Black B. L., Martin J. F., Olson E. N. (1995) Cooperative activation of muscle gene expression by MEF2 and myogenic bHLH proteins. Cell 83, 1125–1136 - PubMed
- Halevy O., Novitch B. G., Spicer D. B., Skapek S. X., Rhee J., Hannon G. J., Beach D., Lassar A. B. (1995) Correlation of terminal cell cycle arrest of skeletal muscle with induction of p21 by MyoD. Science 267, 1018–1021 - PubMed
Publication types
MeSH terms
Substances
LinkOut - more resources
Full Text Sources
Molecular Biology Databases
Research Materials
Miscellaneous


