RhoGDI2 suppresses lung metastasis in mice by reducing tumor versican expression and macrophage infiltration - PubMed (original) (raw)
. 2012 Apr;122(4):1503-18.
doi: 10.1172/JCI61392. Epub 2012 Mar 12.
Affiliations
- PMID: 22406535
- PMCID: PMC3314474
- DOI: 10.1172/JCI61392
RhoGDI2 suppresses lung metastasis in mice by reducing tumor versican expression and macrophage infiltration
Neveen Said et al. J Clin Invest. 2012 Apr.
Abstract
Half of patients with muscle-invasive bladder cancer develop metastatic disease, and this is responsible for most of the deaths from this cancer. Low expression of RhoGTP dissociation inhibitor 2 (RhoGDI2; also known as ARHGDIB and Ly-GDI) is associated with metastatic disease in patients with muscle-invasive bladder cancer. Moreover, a reduction in metastasis is observed upon reexpression of RhoGDI2 in xenograft models of metastatic cancer. Here, we show that RhoGDI2 suppresses lung metastasis in mouse models by reducing the expression of isoforms V1 and V3 of the proteoglycan versican (VCAN; also known as chondroitin sulfate proteoglycan 2 [CSPG2]). In addition, we found that high versican levels portended poor prognosis in patients with bladder cancer. The functional importance of tumor expression of versican in promoting metastasis was established in in vitro and in vivo studies in mice that implicated a role for the chemokine CCL2 (also known as MCP1) and macrophages. Further analysis indicated that RhoGDI2 suppressed metastasis by altering inflammation in the tumor microenvironment. In summary, we demonstrate what we believe to be a new mechanism of metastasis suppression that works by reducing host responses that promote metastatic colonization of the lung. Therapeutic targeting of these interactions may provide a novel adjuvant strategy for delaying the appearance of clinical metastasis in patients.
Figures
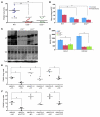
Figure 1. GDI2 and versican expression and disease outcome.
(A) Kaplan-Meier curves showing stratification of DSS as a function of GDI2 RNA expression in 2 independent studies (left: Sanchez-Carbayo et al., ref. ; right: Kim et al., ref. 46). (B) Supervised clustering of microarray analysis of metastatic UMUC3 cells reexpressing GDI2-GFP and GFP controls was limited to 92 significantly differentially expressed probes by more than 3-fold (right). Unsupervised clustering of 92 GDI2-regulated probes in 46 human urothelial carcinomas (43) (left). Stage of the tumor is classified as carcinoma in situ (green), NMI (orange), and MI (black) urothelial bladder cancer. Probes for VCAN mRNA are indicated by arrowheads. (C) Dot plots of standardized (z scored), logged (base 2) expression of VCAN probes comparing NMI and MI urothelial bladder cancer in 4 independent studies shown (upper left: Sanchez-Carbayo et al., ref. ; upper right: Stransky et al., ref. ; lower left: Dyrskjot et al., ref. ; lower right: Kim et al., ref. 46). Differences in distributions were tested by the Mann-Whitney U test. (D) Kaplan-Meier plots showing stratification of DSS as a function of VCAN expression in the same 2 studies as in A (left: Sanchez-Carbayo et al., ref. ; right: Kim et al., ref. 46). Reproduced with permission from the Journal of Clinical Oncology (44), Molecular Cancer (46), Cancer Research (43), and Nature Genetics (45, 47).
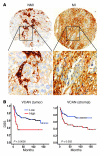
Figure 2. The expression of VCAN in human bladder tumors.
(A) Immunohistochemical staining and scoring of VCAN in NMI (n = 92) and MI (n = 102) tumors. Original magnification, ×100 (upper panels); ×200 (lower panels). (B) Kaplan-Meier plots showing stratification of DSS for all patients as a function of tumor cytoplasmic VCAN (left) and intensity stromal VCAN (right) staining (log rank, P < 0.0005 and P = 0.002, respectively).
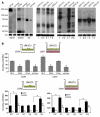
Figure 3. GDI2 overexpression reduces lung metastasis and VCAN expression.
(A) WBs showing the expression of GFP and GFP in UMUC3 cells. Tub, tubulin. (B) The expression of VCAN transcripts (left) and protein (right) in GFP and GDI2 cells was determined by qRT-PCR and WB of cell lysates and CM. Bars represent mean ± SEM, n = 3. *P < 0.05; **P < 0.01 (compared with GFP, Student’s t test). Relative expression was normalized to the housekeeping gene GUS-B. Equal protein loading was confirmed by tubulin. (C) Tumor cell burden in lungs was determined by qPCR of human 12p chromosome at indicated time points after tail-vein injection of cancer cells. Bars represent mean ± SEM, n = 3. *P < 0.05, Student’s t test, comparing GFP and GDI2. **P < 0.001, 1-way ANOVA with Tukey’s multiple comparison post-hoc test. (D) Photos of lung metastasis (mets) (circled in yellow) and scatter plot of the incidence and number of visible metastases 6 weeks after injection of cancer cells. *P < 0.05, χ2 test, comparing the incidence; **P < 0.01, Student’s t test, comparing the number of metastases. (E) WB of VCAN isoforms in representative lung lysates (n = 3) 6 weeks after injection of cancer cells shown in D.
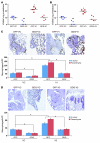
Figure 4. GDI2-reduced lung metastases are associated with decreased lung inflammation.
(A) Mac2 immunostaining showing macrophage infiltration in lung metastatic foci (circled in yellow) and the surrounding lung parenchyma. Bars represent mean ± SEM of macrophages counted in 6 random fields. **P < 0.01, Student’s t test. Original magnification, ×200. (B and C) Human IL-6 (hIL-6), CCL2 (hCCL2), murine IL-6 (mIL-6), and CCL2 (mCCL2), and Cox-2 activity were determined in lung lysates. Bars represent mean ± SEM. n = 3, performed in duplicate. *P < 0.05; **P < 0.01, Student’s t test. HPF, high-powered field.
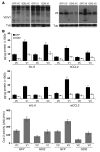
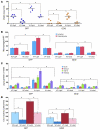
Figure 5. GDI2 modulates cancer cell–macrophage interactions through VCAN.
(A) Schema of UMUC3-U937 cocultures. WB showing the expression of VCAN isoforms in UMUC3 or U937 lysates cocultured for 72 hours. (B) qRT-PCR (after 6 hours) in cell lines under the same conditions as in panel A. In all coculture experiments, bars represent evaluated cells (U937 or UMUC3) that appear below the lines in the x axis labels. *P < 0.01, compared with GFP in single-cell culture; **P < 0.01, comparing GFP and GDI2 in cocultures; #P < 0.05, comparing U937 in single and cocultures; ##P < 0.05, comparing U937 cocultured with GFP and GDI2. (C) hIL-6 and hCCL2 in 72-hour CM of single cultures of U937 (gray bars) or UMUC3 (either GFP or GDI2, black bars) and in cocultures of U937 with UMUC3 (either GFP or GDI2, white bars). *P < 0.05, comparing GFP and GDI2; **P < 0.01, comparing single cell to coculture. (D) Cox-2 activity was determined in cell lysates under the same conditions as in A. *P < 0.01, comparing single cells to cocultures; #P < 0.01, comparing cocultures with GFP versus GDI2. Student’s t test was used.
Figure 6. Effect of genetic manipulation of VCAN in UMUC3 cells on their in vitro appearance.
(A) WB confirming the efficiency of Vcan knockdown/expression in UMUC3-GFP and UMUC3-GDI2 cells transduced with shRNA lentiviruses targeting all VCAN isoforms (sh_Vcan_), an irrelevant nontarget (NTsh), or retroviruses overexpressing V1, V3, and V2 and their empty vector controls (VC). Numbers represent the relative band density normalized to corresponding tubulin, with GFP-VC considered as 1. (B) Engineered UMUC3 cells in A were allowed to invade Matrigel-coated 8-μm inserts toward CGM or U937. *P < 0.05. Bars represent mean ± SEM of counted invading/attracted cells of 3 independent experiments performed in triplicate. Student’s t test was used.
Figure 7. VCAN expression is necessary for lung metastasis.
(A) Photos of lung metastasis (circled in yellow) and scatter plots showing the incidence and number of visible lung metastases 6 weeks after tail-vein injection of UMUC3-sh_Vcan_ and NTsh controls. *P < 0.01, χ2 test comparing incidence; #P < 0.01, Student’s t test, comparing the number of visible lung metastases. (B) The expression of VCAN isoforms in lung lysates was determined by WB at 6 weeks after inoculation in samples from A. (C) The number of macrophages is shown and counted as described in Methods. Bars represent mean ± SEM of the number of macrophages (6 random fields). Original magnification, ×200. *P < 0.05, Student’s t test. (D) hIL-6, hCCL2, mIL-6, and mCCL2 levels and Cox-2 activity in lung lysates. Bars represent mean ± SEM (n = 3, performed in duplicate). *P < 0.05, Student’s t test.
Figure 8. Reexpression of V1 and V3 VCAN mitigates RGDI2 metastasis suppressor effect.
(A and B) Scatter plots showing the incidence of number of lung metastases after reexpression of V1 and V3 in GFP and GDI2 cells. *P < 0.01, χ2 test comparing the incidence; #P < 0.01, Student’s t test, comparing the number of visible metastases. (C and D) The number of macrophages in the lungs corresponding to samples shown in A and B counted as described in Methods. Bars represent mean ± SEM of the number of macrophages/HPF. *P < 0.05, Student’s t test.
Figure 9. Forced expression of V1 and V3 in GFP and GD12 cells increased lung VCAN and inflammatory mediators.
(A) WB showing the expression of VCAN isoforms in metastasis-bearing lungs. (B) hIL-6, hCCL2, mIL-6, and mCCL2 levels and Cox-2 activity in lung lysates. Bars represent mean ± SEM (n = 3, performed in duplicate).
Figure 10. Involvement of CCL2 and CCR2 in VCAN-mediated lung metastasis.
(A) Scatter plots of the incidence and multiplicity of lung metastases after tail-vein injection of murine MB49 cells (1 × 10⁴ cells/100 μl) in Ccl2–/– and Ccr2–/– mice and their WT counterparts (WT, C57BL/6). *P < 0.05, χ2 test, comparing the incidence; **P < 0.01, Student’s t test, comparing the number of lung metastases between WT and Ccl2–/– aand Ccr2–/– cohorts, 3 weeks after injection of tumor cells. (B) Mac2 IHC of lung sections of mice in A. Bars represent mean ± SEM of the number of macrophages/HPF. *P < 0.05, Student’s t test. (C) WB of murine V1 (β-GAG) and V2 (α-GAG) in tumor-bearing lung lysates. (D) Murine cytokines in WT, Ccl2–/–, and Ccr2–/– lung lysates. Bars represent the mean ± SEM of 3 independent experiments performed in duplicates. *P < 0.01, Student’s t test. (E and F) Scatter plots of the incidence and multiplicity of lung metastases developed after tail-vein injection of transfected/transduced UMUC3 cells in nude mice treated with CCR2 antagonist RS 102895 (RS) and its VC or neutralizing antibody against human CCL2 (anti-CCL2) and isotype control IgG. *P < 0.01, χ2 test, comparing the incidence, and Student’s t test, comparing the number of visible lung metastases.
Figure 11. Pharmacologic depletion of macrophages blocks V1-driven lung metastasis and inflammation.
(A) Plots of incidence and multiplicity of lung metastases after tail-vein injection of V1-expressing GFP and GDI2 cells in nude mice treated with liposome-encapsulated clodronate (clod) or empty liposome vehicle (LipV). (B) Bars are mean ± SEM of the number of macrophages infiltrating the lungs/HPF. *P < 0.05, Student’s t test. (C and D) Human and murine cytokines and Cox-2 activity in lung lysates of mice under the experimental conditions described above. *P < 0.05, Student’s t test.
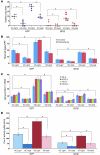
Figure 12. Pharmacologic depletion of macrophages blocks V3-driven lung metastasis and inflammation.
(A) Scatter plots of the incidence and multiplicity of lung metastases that developed after tail-vein injection of V3-expressing GFP and GDI2 cells in nude mice with and without clodronate treatment. (B) Bars represent the mean ± SEM of the number of macrophages infiltrating the lungs/HPF. *P < 0.05, Student’s t test. (C and D) Human and murine cytokines and Cox-2 activity in lung lysates of mice under the experimental conditions described above. *P < 0.05, Student’s t test.
Comment in
- Bladder cancer: New insight into the mechanisms of lung metastasis.
Payton S. Payton S. Nat Rev Urol. 2012 Apr 17;9(5):234. doi: 10.1038/nrurol.2012.60. Nat Rev Urol. 2012. PMID: 22508458 No abstract available.
Similar articles
- Neuromedin U is regulated by the metastasis suppressor RhoGDI2 and is a novel promoter of tumor formation, lung metastasis and cancer cachexia.
Wu Y, McRoberts K, Berr SS, Frierson HF Jr, Conaway M, Theodorescu D. Wu Y, et al. Oncogene. 2007 Feb 1;26(5):765-73. doi: 10.1038/sj.onc.1209835. Epub 2006 Jul 31. Oncogene. 2007. PMID: 16878152 - Endothelin axis is a target of the lung metastasis suppressor gene RhoGDI2.
Titus B, Frierson HF Jr, Conaway M, Ching K, Guise T, Chirgwin J, Hampton G, Theodorescu D. Titus B, et al. Cancer Res. 2005 Aug 15;65(16):7320-7. doi: 10.1158/0008-5472.CAN-05-1403. Cancer Res. 2005. PMID: 16103083 - Pathways of metastasis suppression in bladder cancer.
Said N, Theodorescu D. Said N, et al. Cancer Metastasis Rev. 2009 Dec;28(3-4):327-33. doi: 10.1007/s10555-009-9197-4. Cancer Metastasis Rev. 2009. PMID: 20013033 Review. - RhoC Is an Unexpected Target of RhoGDI2 in Prevention of Lung Colonization of Bladder Cancer.
Griner EM, Dancik GM, Costello JC, Owens C, Guin S, Edwards MG, Brautigan DL, Theodorescu D. Griner EM, et al. Mol Cancer Res. 2015 Mar;13(3):483-92. doi: 10.1158/1541-7786.MCR-14-0420. Epub 2014 Dec 16. Mol Cancer Res. 2015. PMID: 25516960 Free PMC article. - RhoGDI2: a new metastasis suppressor gene: discovery and clinical translation.
Harding MA, Theodorescu D. Harding MA, et al. Urol Oncol. 2007 Sep-Oct;25(5):401-6. doi: 10.1016/j.urolonc.2007.05.006. Urol Oncol. 2007. PMID: 17826660 Review.
Cited by
- Versican is upregulated in circulating monocytes in patients with systemic sclerosis and amplifies a CCL2-mediated pathogenic loop.
Masuda A, Yasuoka H, Satoh T, Okazaki Y, Yamaguchi Y, Kuwana M. Masuda A, et al. Arthritis Res Ther. 2013 Jul 11;15(4):R74. doi: 10.1186/ar4251. Arthritis Res Ther. 2013. PMID: 23845159 Free PMC article. - New insights into the correlations between circulating tumor cells and target organ metastasis.
Zhan Q, Liu B, Situ X, Luo Y, Fu T, Wang Y, Xie Z, Ren L, Zhu Y, He W, Ke Z. Zhan Q, et al. Signal Transduct Target Ther. 2023 Dec 21;8(1):465. doi: 10.1038/s41392-023-01725-9. Signal Transduct Target Ther. 2023. PMID: 38129401 Free PMC article. Review. - Differential functions of RhoGDIβ in malignant transformation and progression of urothelial cell following N-butyl-N-(4-hydmoxybutyl) nitrosamine exposure.
Hua X, Zou R, Bai X, Yang Y, Lu J, Huang C. Hua X, et al. BMC Biol. 2023 Aug 28;21(1):181. doi: 10.1186/s12915-023-01683-2. BMC Biol. 2023. PMID: 37635218 Free PMC article. - TPL2 kinase regulates the inflammatory milieu of the myeloma niche.
Hope C, Ollar SJ, Heninger E, Hebron E, Jensen JL, Kim J, Maroulakou I, Miyamoto S, Leith C, Yang DT, Callander N, Hematti P, Chesi M, Bergsagel PL, Asimakopoulos F. Hope C, et al. Blood. 2014 May 22;123(21):3305-15. doi: 10.1182/blood-2014-02-554071. Epub 2014 Apr 10. Blood. 2014. PMID: 24723682 Free PMC article. - Extracellular matrix and the myeloid-in-myeloma compartment: balancing tolerogenic and immunogenic inflammation in the myeloma niche.
Asimakopoulos F, Hope C, Johnson MG, Pagenkopf A, Gromek K, Nagel B. Asimakopoulos F, et al. J Leukoc Biol. 2017 Aug;102(2):265-275. doi: 10.1189/jlb.3MR1116-468R. Epub 2017 Mar 2. J Leukoc Biol. 2017. PMID: 28254840 Free PMC article. Review.
References
- Gildea JJ, et al. RhoGDI2 is an invasion and metastasis suppressor gene in human cancer. Cancer Res. 2002;62(22):6418–6423. - PubMed
- Wu Y, Siadaty MS, Berens ME, Hampton GM, Theodorescu D. Overlapping gene expression profiles of cell migration and tumor invasion in human bladder cancer identify metallothionein 1E and nicotinamide N-methyltransferase as novel regulators of cell migration. Oncogene. 2008;27(52):6679–6689. doi: 10.1038/onc.2008.264. - DOI - PMC - PubMed
- Dours-Zimmermann MT, Zimmermann DR. A novel glycosaminoglycan attachment domain identified in two alternative splice variants of human versican. J Biol Chem. 1994;269(52):32992–32998. - PubMed
Publication types
MeSH terms
Substances
LinkOut - more resources
Full Text Sources
Other Literature Sources
Medical
Molecular Biology Databases
Miscellaneous

